Introdução
Poluentes atmosféricos, incluindo material particulado, dióxido de nitrogênio, dióxido de enxofre, ozônio e monóxido de carbono, são indicadores críticos em estudos de saúde pública por seus impactos na saúde humana. Esses poluentes têm várias fontes, como emissões veiculares, atividades industriais e queima de biomassa. A exposição à poluição do ar está associada a doenças respiratórias e cardiovasculares, desfechos adversos ao nascimento e aumento da mortalidade.
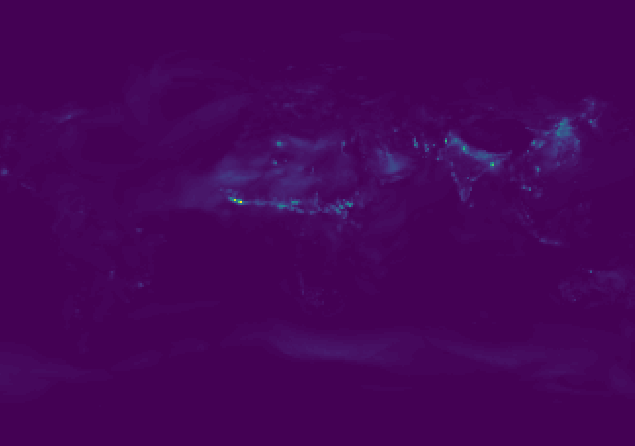
Criei bases de dados de poluentes atmosféricos para municípios brasileiros usando estatísticas zonais com dados da reanálise global EAC4 do Copernicus Atmosphere Monitoring Service (CAMS).
Material particulado
Material particulado é um indicador amplamente usado em estudos de saúde pública por sua associação com desfechos adversos em saúde. Essas partículas finas podem penetrar profundamente no sistema respiratório, alcançar os alvéolos e a corrente sanguínea, aumentando os riscos de doenças cardiovasculares e respiratórias, mortalidade prematura e outras condições crônicas.
Os indicadores de PM foram baixados do Atmosphere Data Store do Copernicus e processados para fornecer três indicadores diários para os municípios brasileiros:
- Valores mínimos: para cada limite municipal e dia, os valores horários mínimos de PM de todas as células que intersectam o município são promediados, resultando no indicador diário mínimo municipal.
- Valores máximos: para cada limite municipal e dia, os valores horários máximos de PM de todas as células que intersectam o município são promediados, resultando no indicador diário máximo municipal.
- Valores médios: para cada limite municipal e dia, os valores horários médios de PM de todas as células que intersectam o município são promediados, resultando no indicador diário médio municipal.
Esses indicadores são apresentados nos formatos Parquet e CSV. Os códigos computacionais usados para criar as bases estão disponíveis abertamente aqui.
As bases estão disponíveis para baixar aqui:
PM 2.5
- 2003-2024:

- jan 2025 - ago 2025:

PM 10
- 2003-2024:

- jan 2025 - ago 2025:

CO
O monóxido de carbono (CO) é um gás produzido principalmente pela combustão incompleta de combustíveis fósseis e representa uma ameaça importante à saúde pública. A exposição de curto prazo a altas concentrações pode causar tontura, dor de cabeça, prejuízo visual, confusão e, em casos graves, morte. A exposição crônica a baixos níveis está associada a problemas cardiovasculares e neurológicos.
Os indicadores de CO foram baixados do Atmosphere Data Store do Copernicus e processados para fornecer três indicadores diários para os municípios brasileiros:
- Valores mínimos: para cada limite municipal e dia, os valores horários mínimos de CO de todas as células que intersectam o município são promediados.
- Valores máximos: para cada limite municipal e dia, os valores horários máximos de CO de todas as células que intersectam o município são promediados.
- Valores médios: para cada limite municipal e dia, os valores horários médios de CO de todas as células que intersectam o município são promediados.
Esses indicadores são apresentados nos formatos Parquet e CSV. Os códigos computacionais usados para criar as bases estão disponíveis abertamente aqui.
As bases estão disponíveis para baixar aqui:
- 2003-2024:

- jan 2025 - ago 2025:

NO2
O dióxido de nitrogênio (NO2) é um poluente atmosférico nocivo gerado principalmente pela combustão de combustíveis fósseis, especialmente por veículos, usinas e atividades industriais. Está relacionado a problemas respiratórios, pois a exposição pode irritar as vias aéreas, reduzir a função pulmonar e aumentar o risco de asma, bronquite e outras doenças respiratórias crônicas.
Os indicadores de NO2 foram baixados do Atmosphere Data Store do Copernicus e processados para fornecer três indicadores diários para os municípios brasileiros:
- Valores mínimos: para cada limite municipal e dia, os valores horários mínimos de NO2 de todas as células que intersectam o município são promediados.
- Valores máximos: para cada limite municipal e dia, os valores horários máximos de NO2 de todas as células que intersectam o município são promediados.
- Valores médios: para cada limite municipal e dia, os valores horários médios de NO2 de todas as células que intersectam o município são promediados.
Esses indicadores são apresentados nos formatos Parquet e CSV. Os códigos computacionais usados para criar as bases estão disponíveis abertamente aqui.
As bases estão disponíveis para baixar aqui:
- 2003-2024:

- jan 2025 - ago 2025:

O3
O ozônio (O3) ao nível do solo é um componente importante do smog e um poluente atmosférico. Diferentemente do ozônio estratosférico, que protege a vida da radiação ultravioleta, o ozônio troposférico é nocivo e tem implicações relevantes para a saúde pública. A exposição de curto prazo pode irritar olhos, nariz e garganta, agravar asma e reduzir a função pulmonar.
Os indicadores de O3 foram baixados do Atmosphere Data Store do Copernicus e processados para fornecer três indicadores diários para os municípios brasileiros:
- Valores mínimos: para cada limite municipal e dia, os valores horários mínimos de O3 de todas as células que intersectam o município são promediados.
- Valores máximos: para cada limite municipal e dia, os valores horários máximos de O3 de todas as células que intersectam o município são promediados.
- Valores médios: para cada limite municipal e dia, os valores horários médios de O3 de todas as células que intersectam o município são promediados.
Esses indicadores são apresentados nos formatos Parquet e CSV. Os códigos computacionais usados para criar as bases estão disponíveis abertamente aqui.
As bases estão disponíveis para baixar aqui:
- 2003-2024:

- jan 2025 - ago 2025:

SO2
O dióxido de enxofre (SO2) é um gás tóxico produzido principalmente pela queima de combustíveis fósseis contendo enxofre, como carvão e petróleo, além de processos industriais como fundição de metais e refino de óleo. Concentrações de SO2 irritam o sistema respiratório, causando tosse, irritação na garganta e falta de ar mesmo em concentrações relativamente baixas.
Os indicadores de SO2 foram baixados do Atmosphere Data Store do Copernicus e processados para fornecer três indicadores diários para os municípios brasileiros:
- Valores mínimos: para cada limite municipal e dia, os valores horários mínimos de SO2 de todas as células que intersectam o município são promediados.
- Valores máximos: para cada limite municipal e dia, os valores horários máximos de SO2 de todas as células que intersectam o município são promediados.
- Valores médios: para cada limite municipal e dia, os valores horários médios de SO2 de todas as células que intersectam o município são promediados.
Esses indicadores são apresentados nos formatos Parquet e CSV. Os códigos computacionais usados para criar as bases estão disponíveis abertamente aqui.
As bases estão disponíveis para baixar aqui:
- 2003-2024:

- jan 2025 - ago 2025:
