Introdução
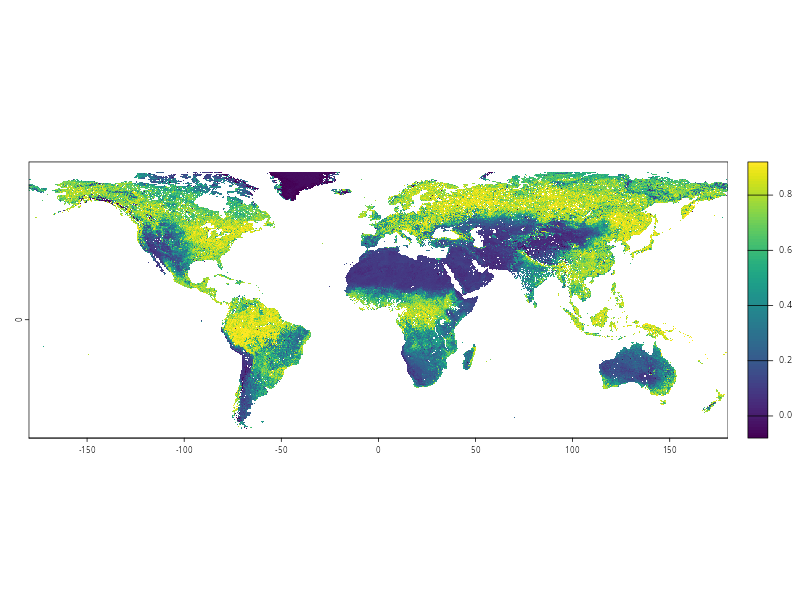
O Índice de Vegetação por Diferença Normalizada (NDVI) é um indicador que quantifica a cobertura e a saúde da vegetação medindo a diferença entre o infravermelho próximo, fortemente refletido por plantas saudáveis, e a luz vermelha, absorvida pela clorofila. Ele captura condições ambientais que influenciam a dinâmica de doenças, nutrição e bem-estar. Por exemplo, o NDVI ajuda a identificar áreas de risco para doenças transmitidas por vetores, como malária, dengue e leishmaniose, já que cobertura vegetal e umidade criam habitats favoráveis para mosquitos e flebotomíneos.
Criei esta base com médias de NDVI para municípios brasileiros usando estatísticas zonais com dados disponíveis no Copernicus Land Monitoring Service.
Dados de origem
Foram usados os seguintes dados de origem.
Métodos
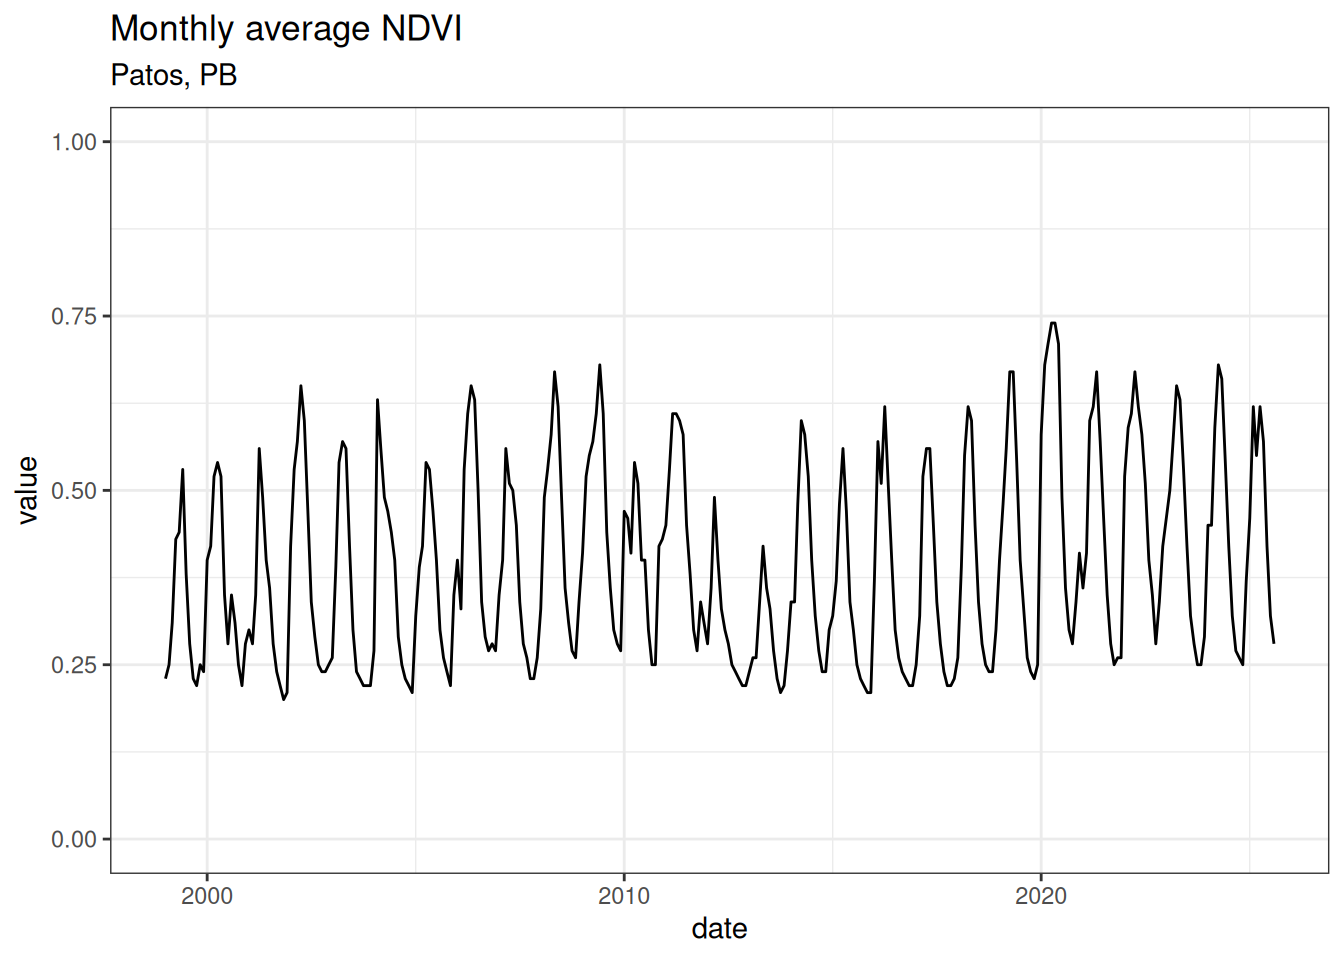
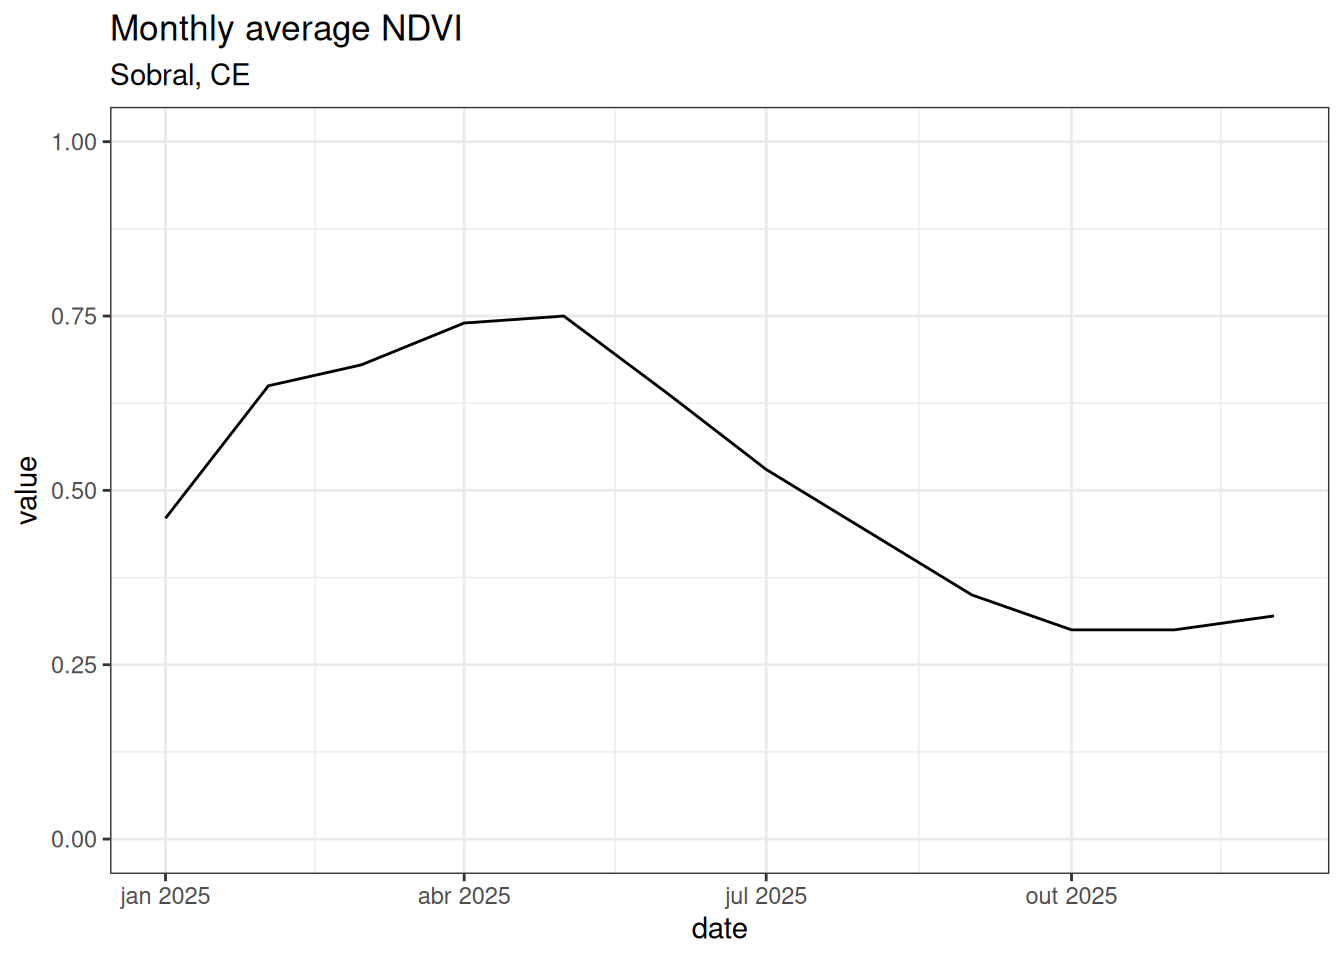
Primeiro, os dados disponíveis de cada mês foram promediados, gerando arquivos mensais de NDVI. Em seguida, para cada mês, foram calculadas as seguintes estatísticas zonais para cada município brasileiro: média, valor máximo, valor mínimo e desvio padrão.
Os scripts em R para baixar, processar e exportar os dados estão disponíveis aqui.
Baixar os dados
1999-2024: 
2025: 
De volta ao topo