flowchart LR
A[All data] --> G[Global Model]
A --> C(Clustering)
C --> K1[Model Cluster 1]
C --> K2[Model Cluster 1]
C --> Kn[Model Cluster n]
G --> P1[Predictions]
K1 --> P2[Predictions]
K2 --> P2
Kn --> P2
P1 --> AC[Accuracy comparison]
P2 --> AC
Specialized AI Models for Predicting Dengue Disease
Dengue spread

Guzman; Harris, 2015
Dengue transmission cycle
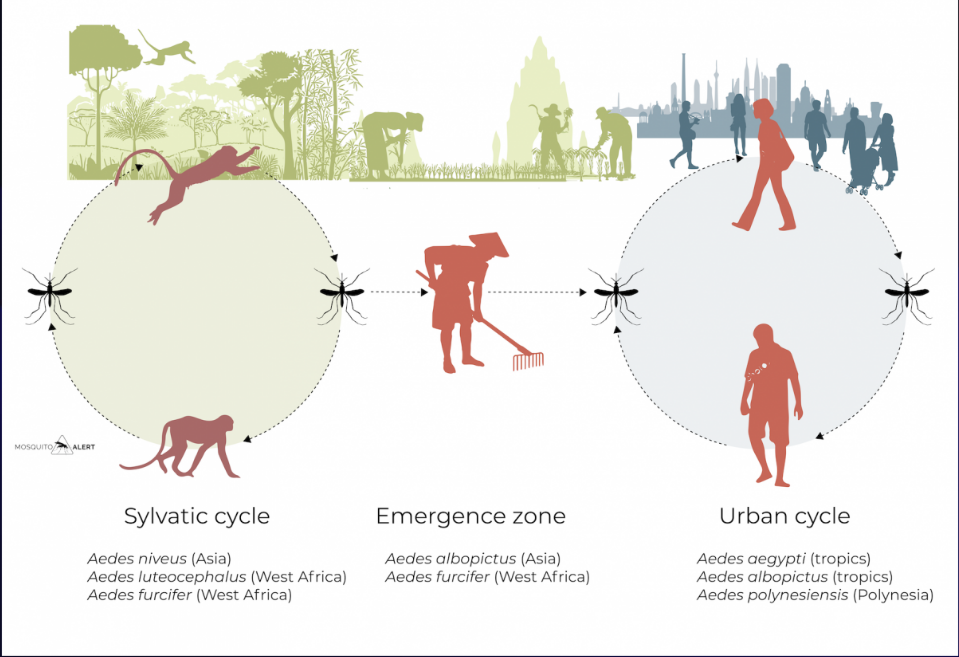
mosquitoalert.com
Dengue symptons

mosquitoalert.com
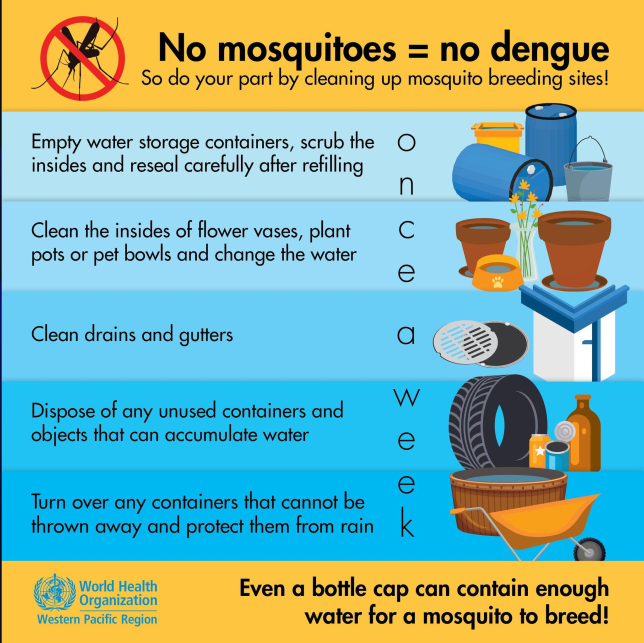
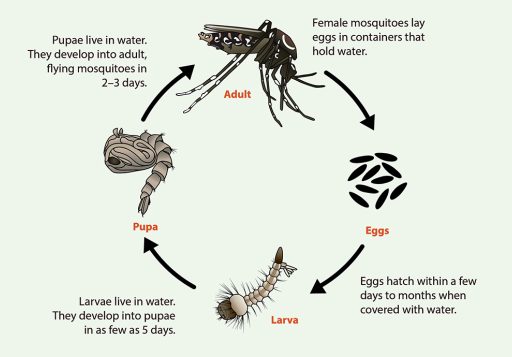
Aedes breeding sites
No need of clean water
Eggs sticks to container walls lige glue
They can survive drying out for up to 8 months
Probable dengue cases in Brazil
per epidemiological week of symptoms onset
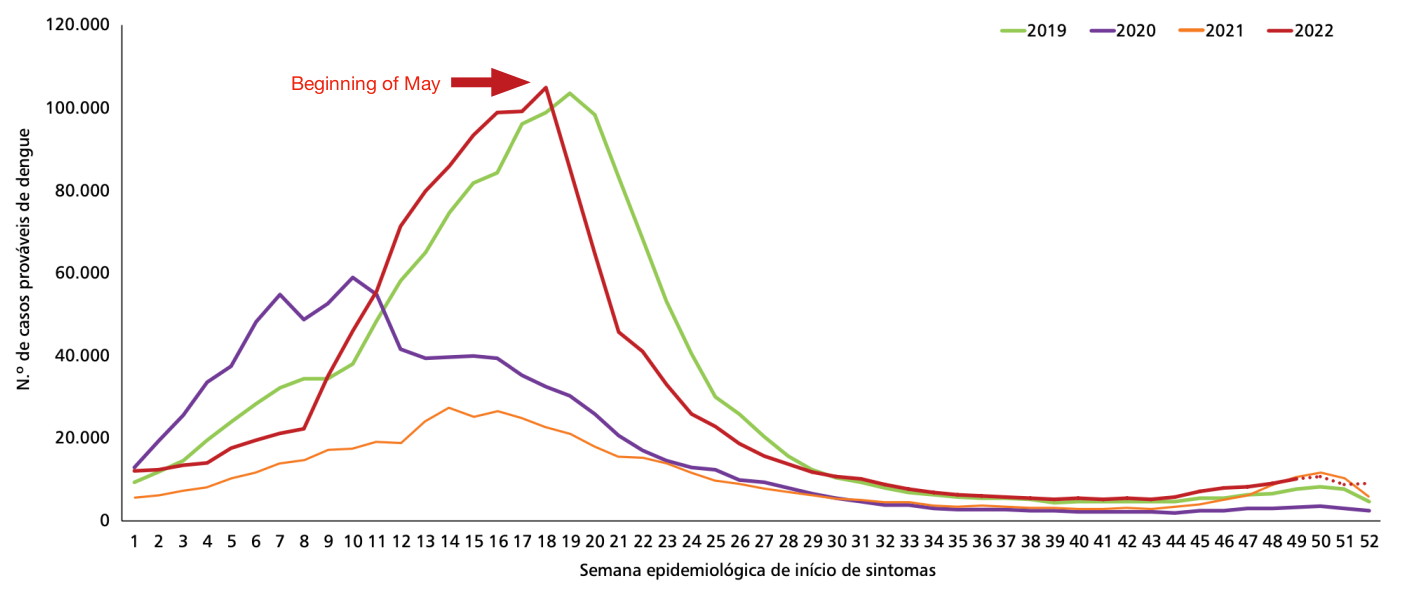
MS. Boletim epidemiológico vol. 54 n. 1 (2023)
Dengue on the news


Dengue outbreaks over time

Azevedo et al, 2020
Dengue and weather covariates
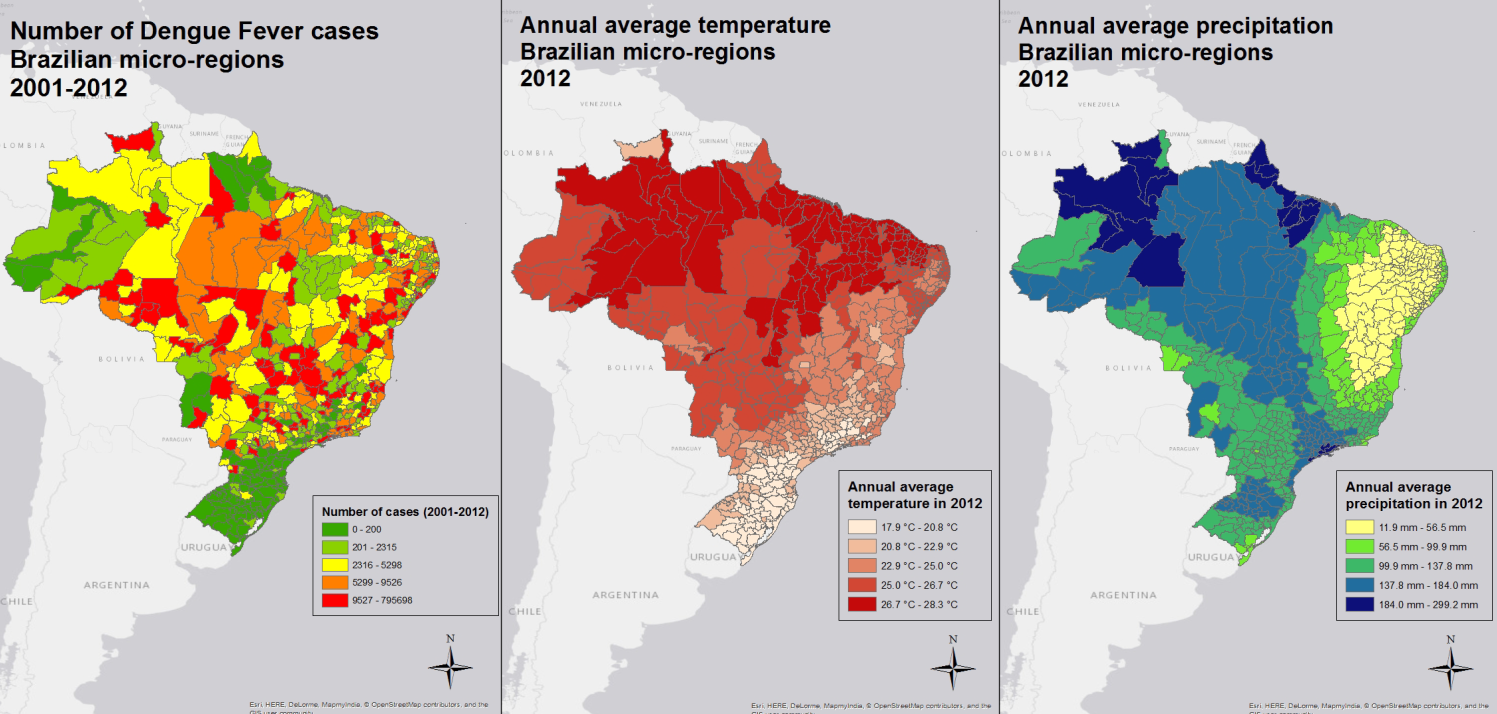
LSE Blogs
Dengue over time
and different regions
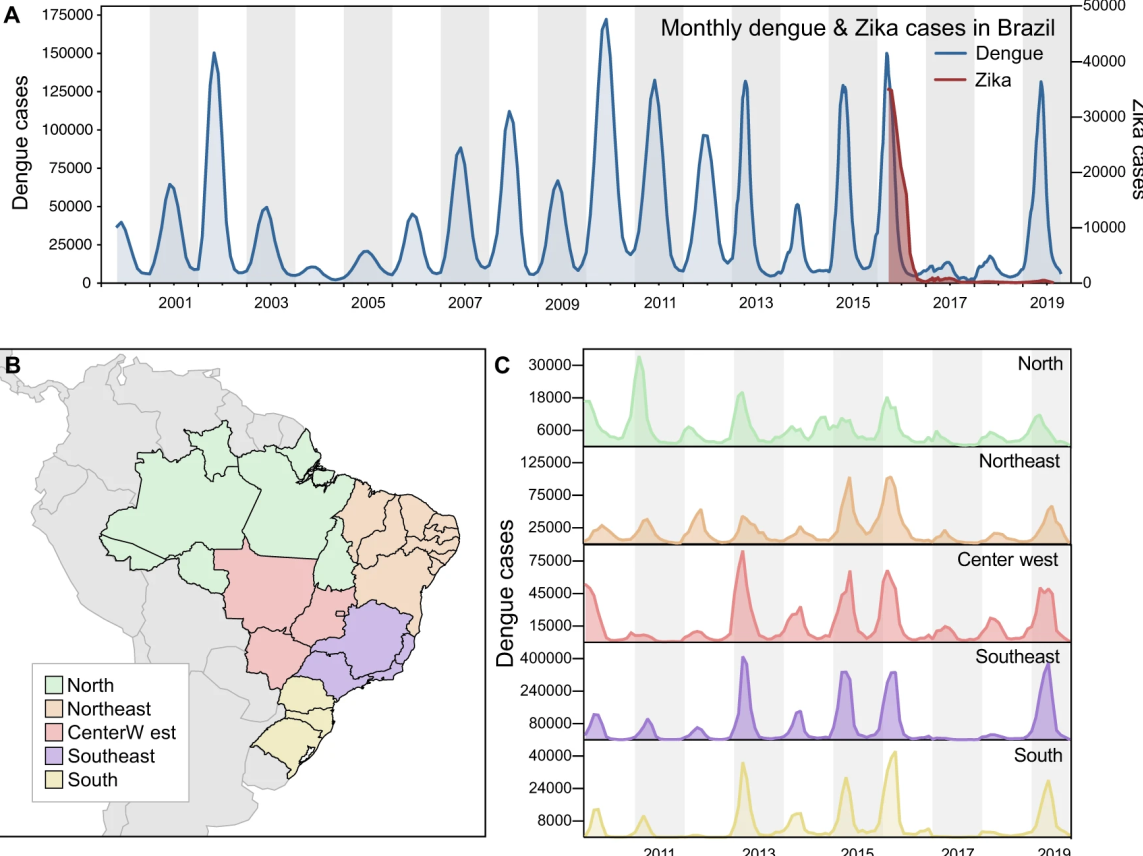
Brito et al. 2021
Territory diversity
- On rainy season, water accumulates on cans, pots and litter present at backyards, junkyards and on the streets.
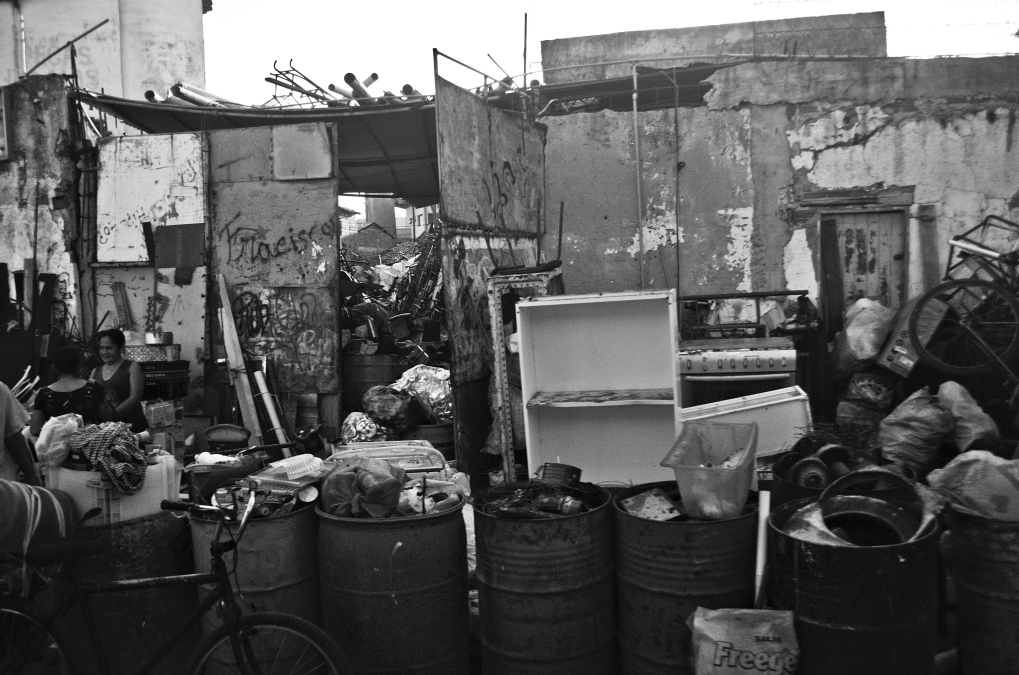
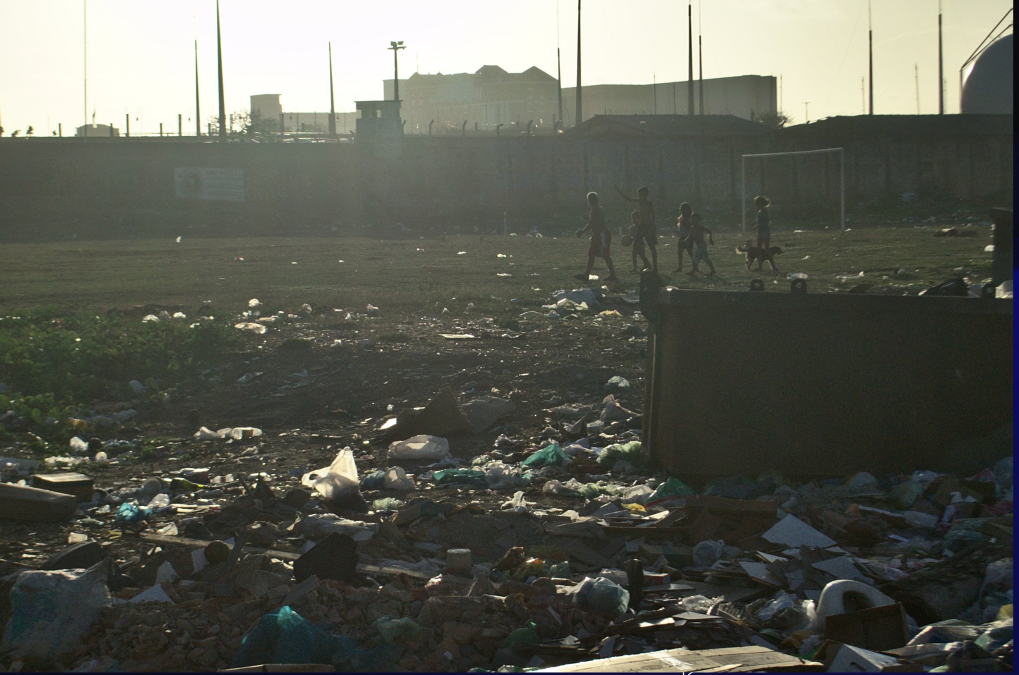
Fortaleza, jan. 2016.
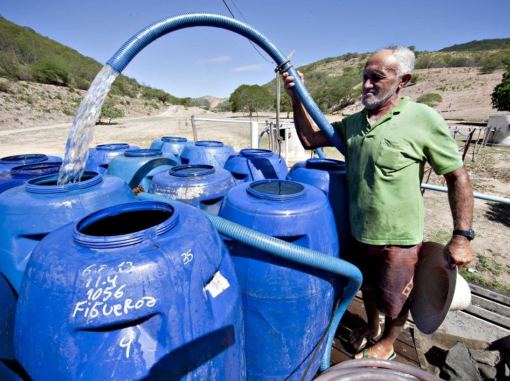
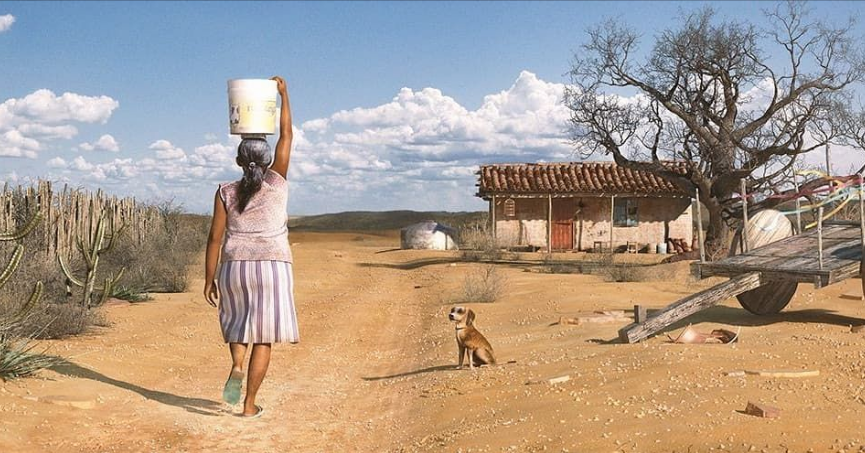
Territory diversity
- On dry season or droughts, water is stored on open drums.
- The same predictor (ie. rain) may have different signal, in respect to other conditions.
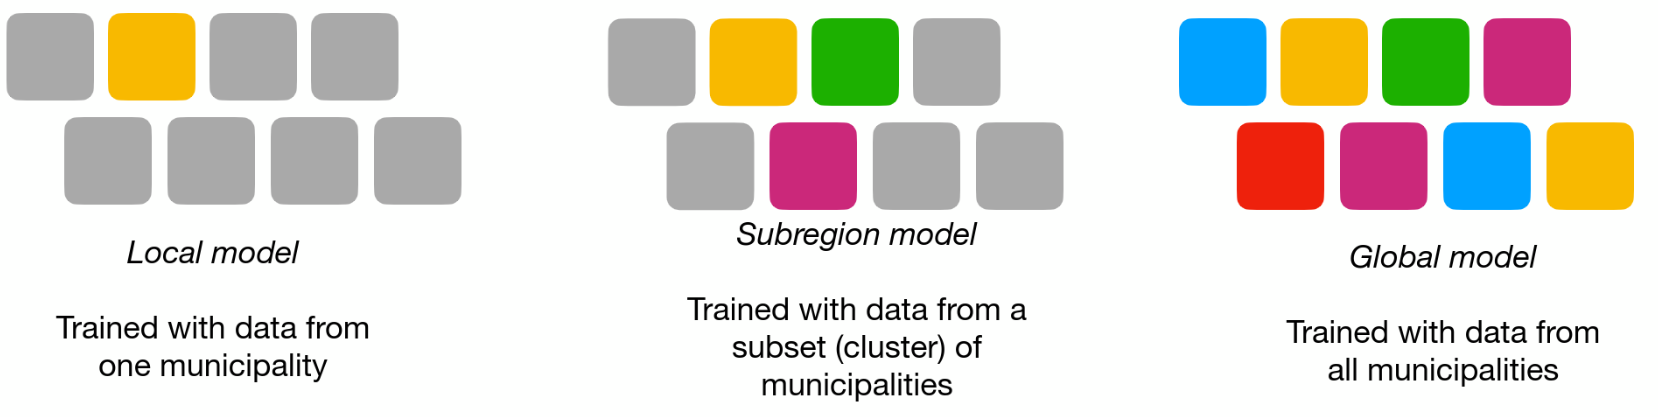
Global and subsets models
Consider each square as a municipality