flowchart LR
A[All data] --> G[Global Model]
A --> C(Clustering)
C --> K1[Model Cluster 1]
C --> K2[Model Cluster 1]
C --> Kn[Model Cluster n]
G --> P1[Predictions]
K1 --> P2[Predictions]
K2 --> P2
Kn --> P2
P1 --> AC[Accuracy comparison]
P2 --> AC
Specialized AI Models for Predicting Dengue Disease
[Short version]
Territory diversity
- On rainy season, water accumulates on cans, pots and litter present at backyards, junkyards and on the streets.
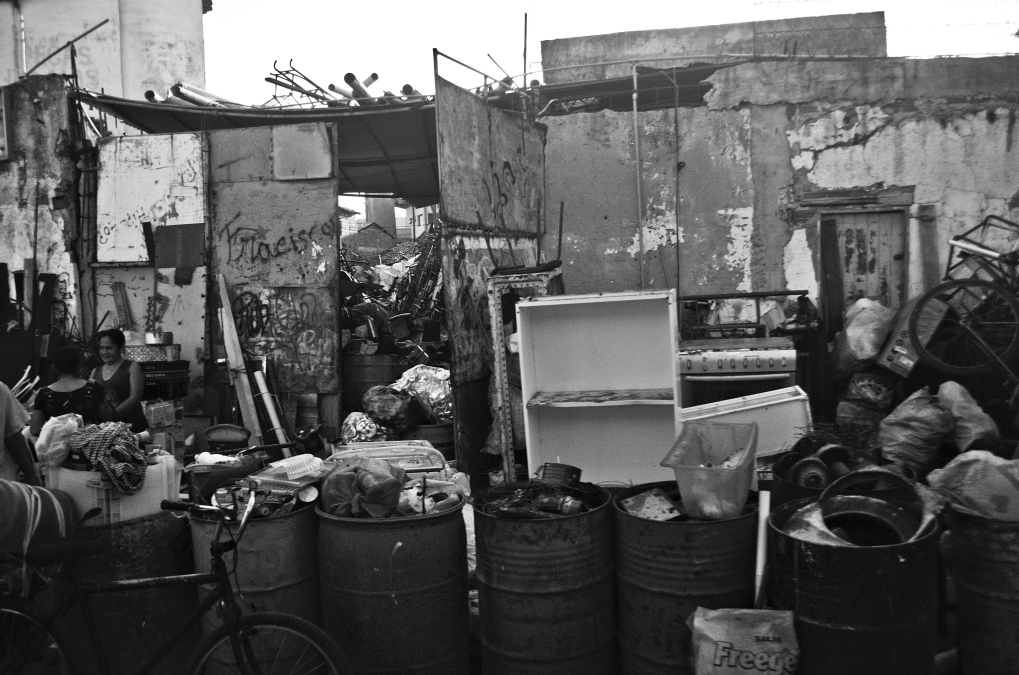
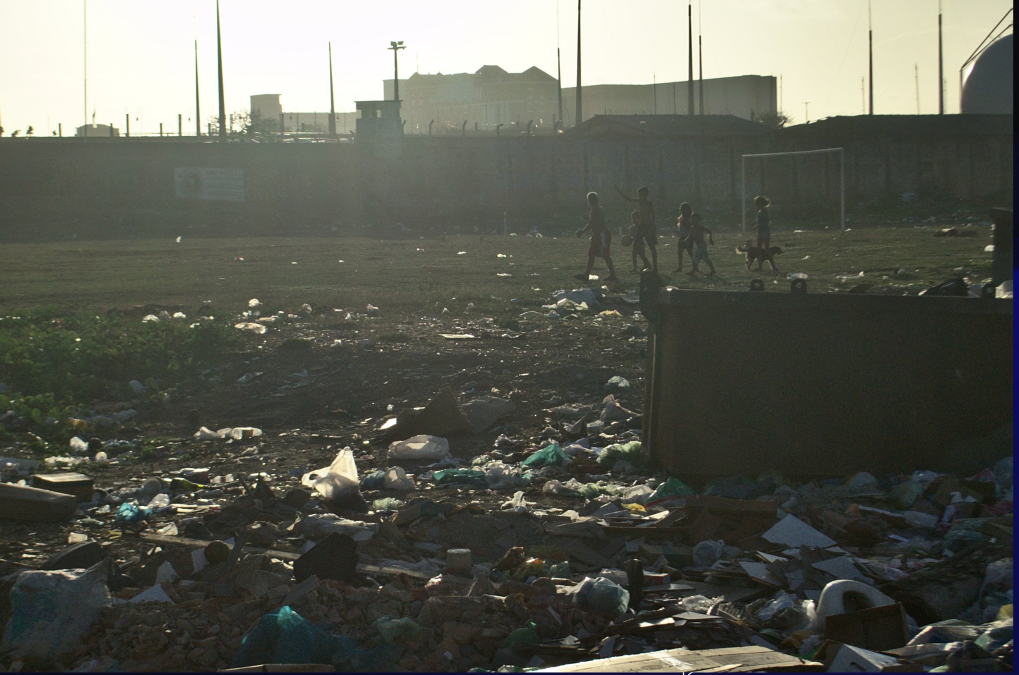
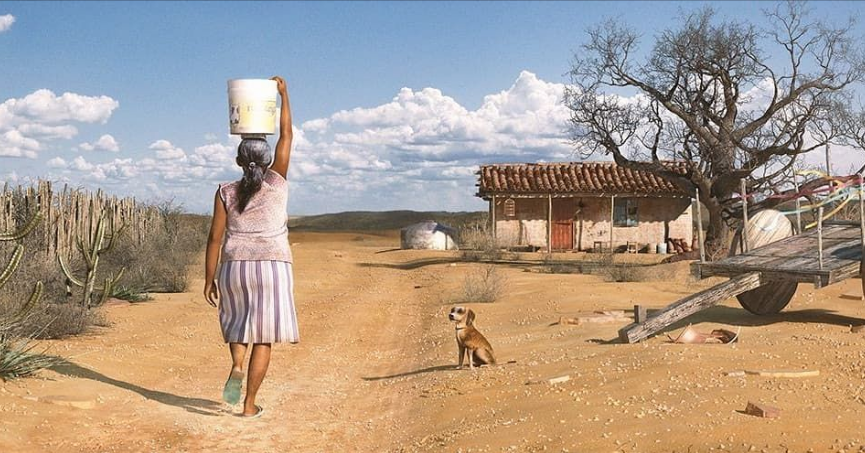
Fortaleza, jan. 2016.
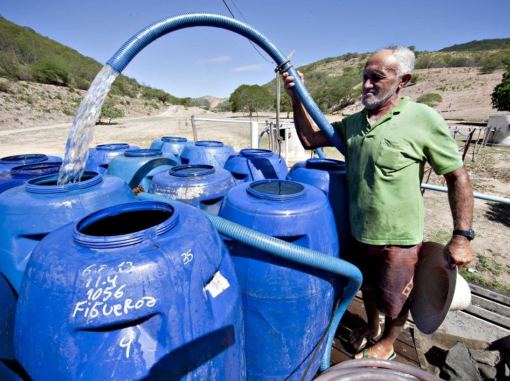
Territory diversity
- On dry season or droughts, water is stored on open drums.
- The same predictor (ie. rain) may have different signal, in respect to other conditions.
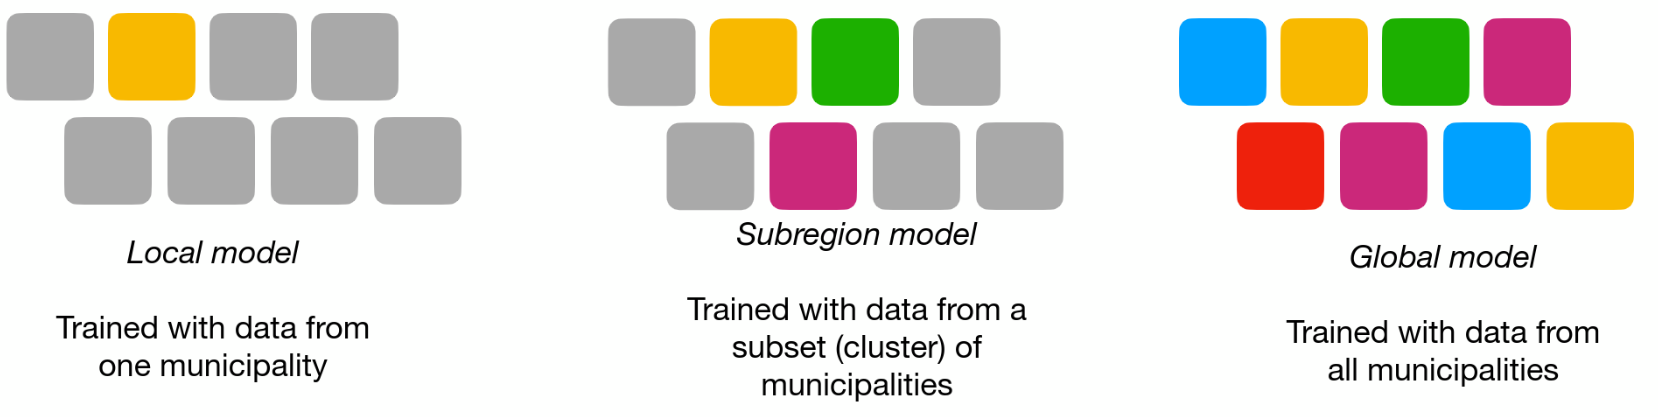
Global and subsets models
Consider each square as a municipality