%%{
  init: {
    'theme': 'base',
    'themeVariables': {
      'fontSize': '30px'
    }
  }
}%%
flowchart LR

climate(Climate) --> vector(Disease vectors) --> health(Human health)
climate --> health
climate --> social(Social & economic \n determinants) --> health
Advances in climate features engineering and subsets modeling
for Dengue forecasting
2024-05-31
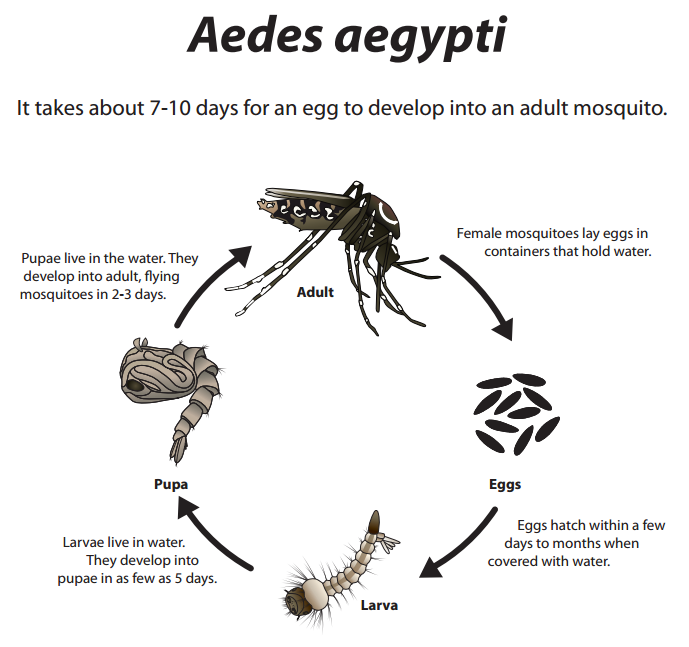
A time-lagged relationship
- Vector life cycle from a time perspective
- Climate conditions from the past leads to the disease incidence of tomorrow
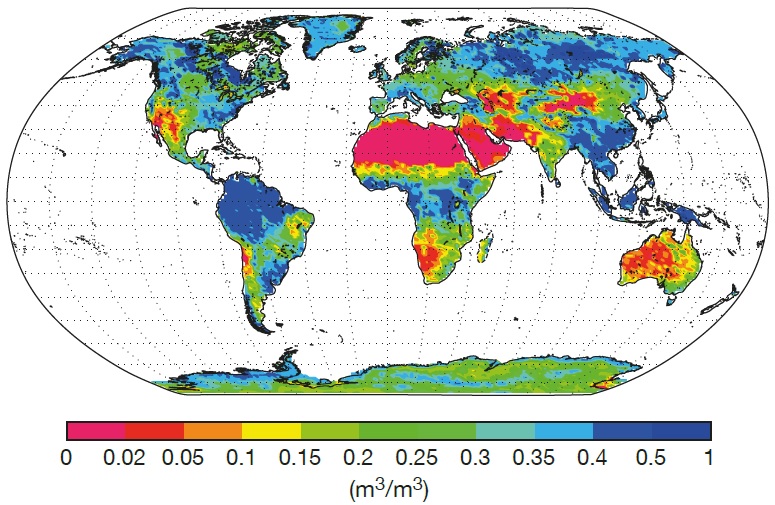
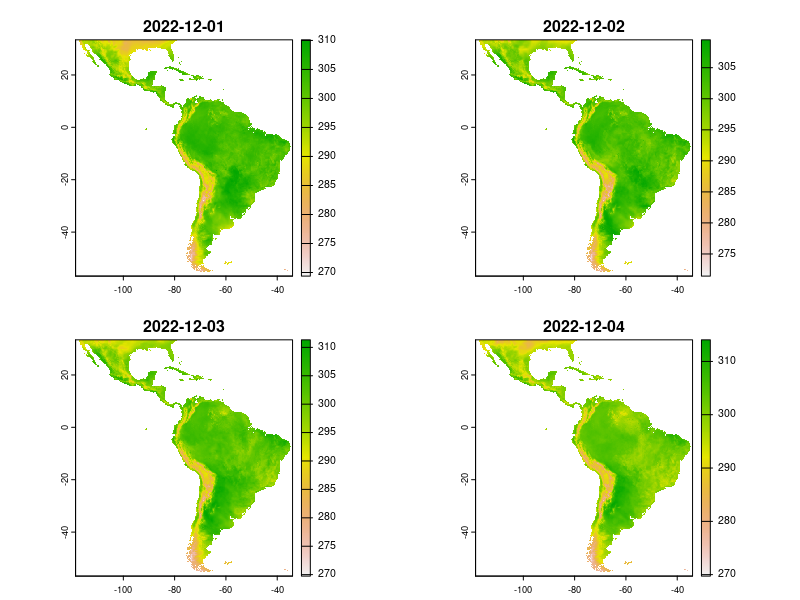
ERA5-Land reanalysis
- Copernicus, ECMWF
- Global coverage
- Hourly data
- 1950 to the present (one week delay)
- Spatial resolution ~9km
- Several climate indicators
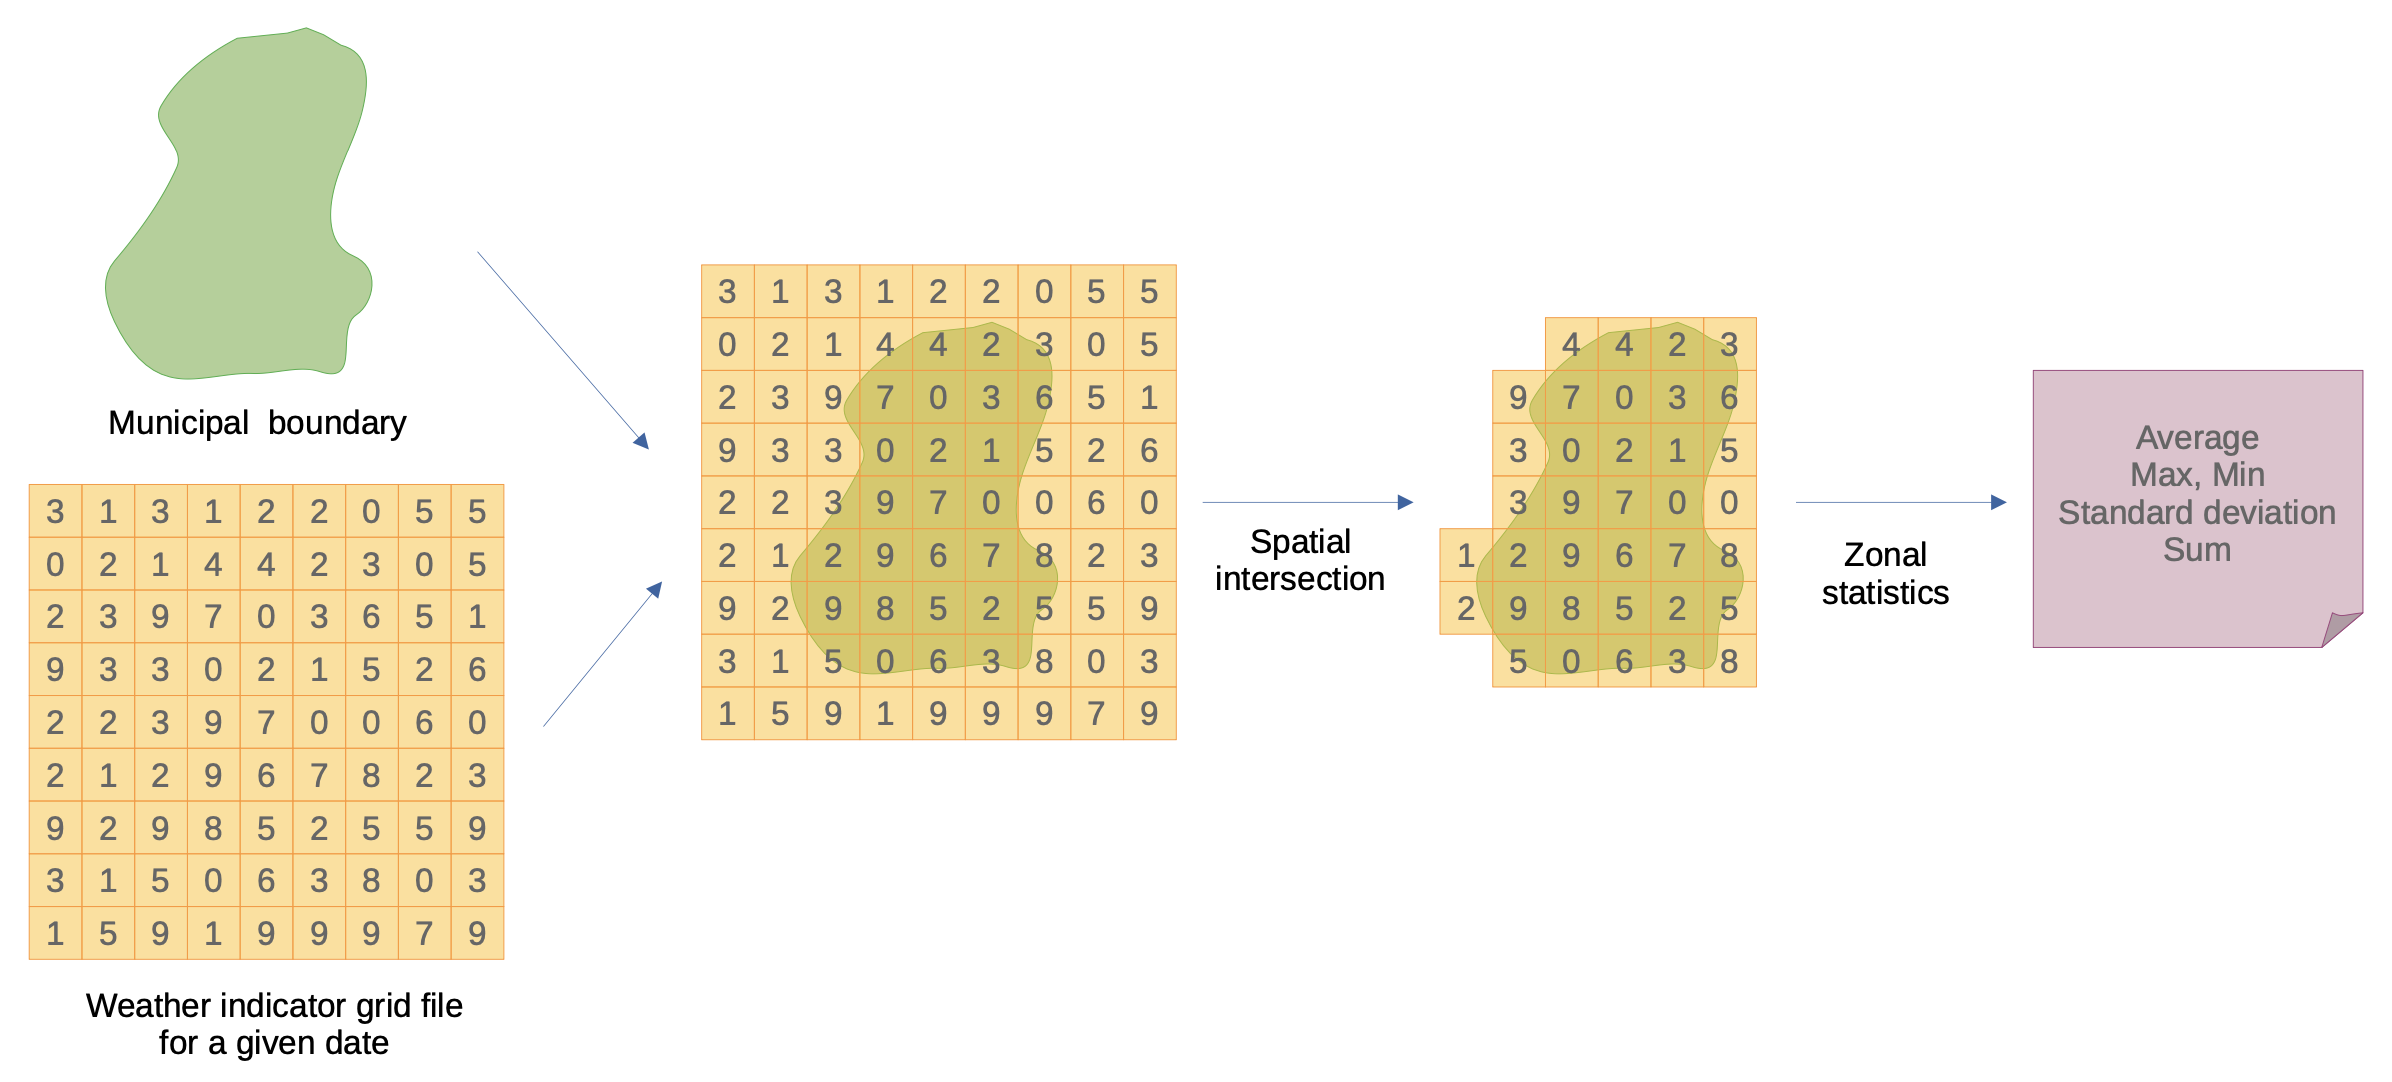
Challenge on data structures
- Climate indicators: grid data
- Disease incidence: tabular, individual cases aggregated by spatial regions and time spans

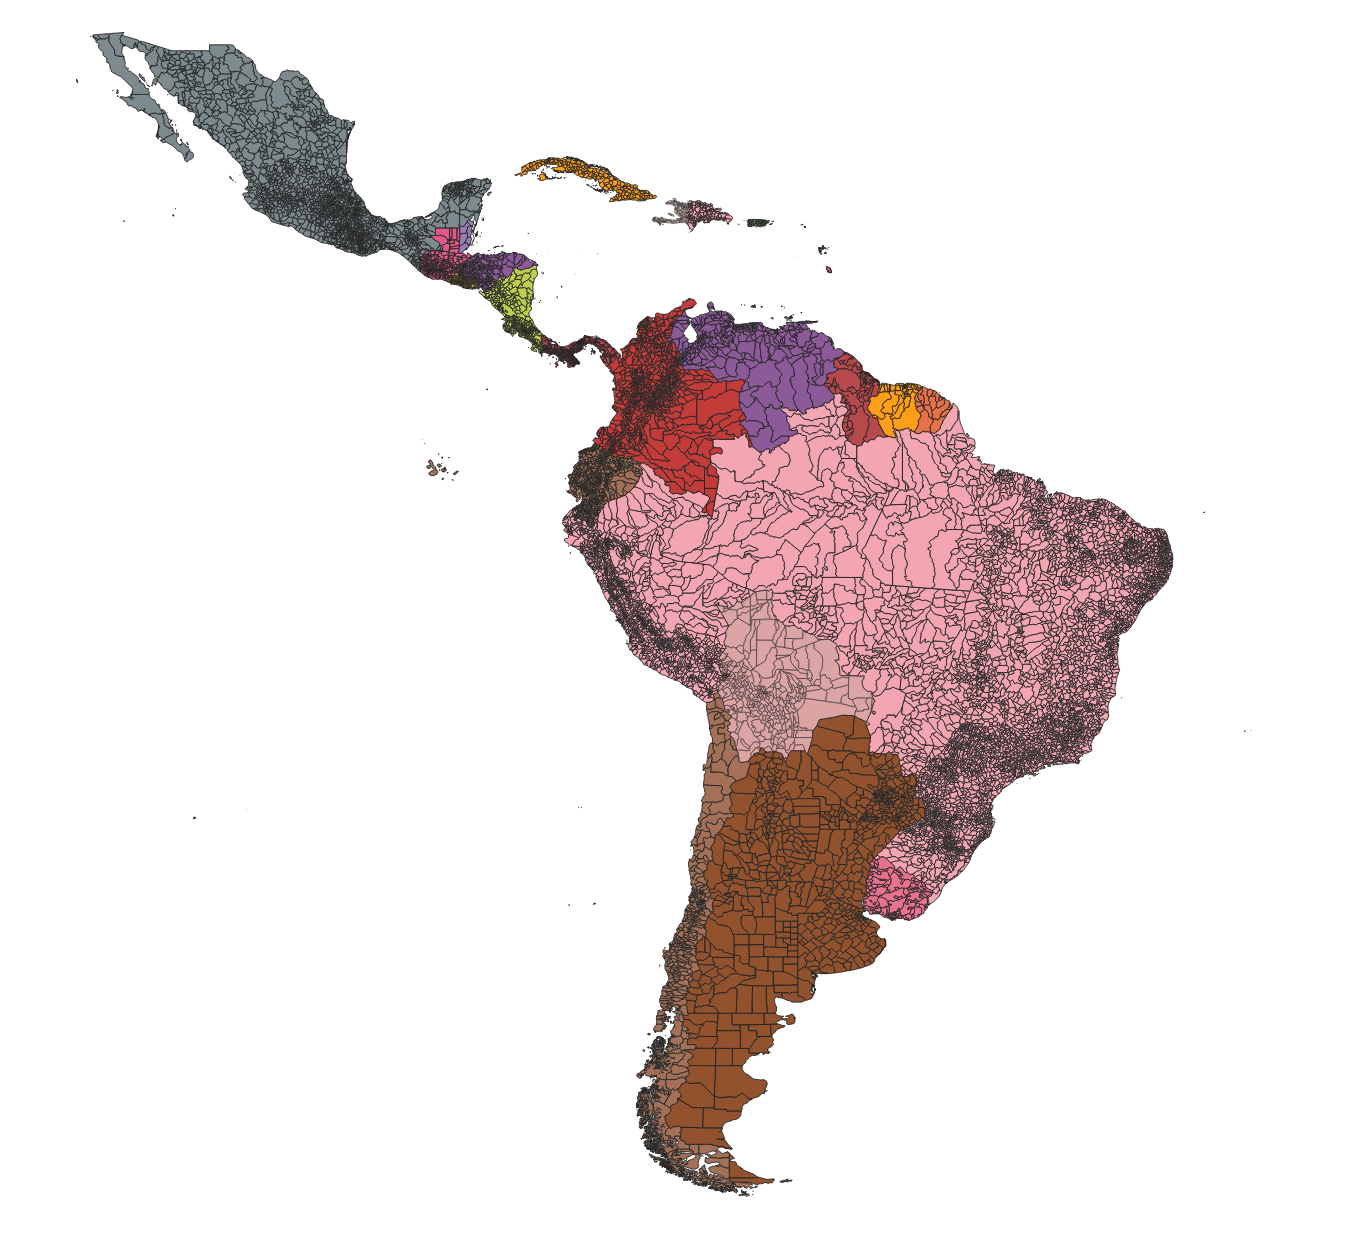
Zonal statistics
Resulting products
- ERA5-Land daily datasets
- 7,105 files, 658.7 GB
- 24,242 downloads on Zenodo
- Daily zonal statistics of climate indicators
- 8 selected indicators, 5,570 municipalities
- 6,085,749,761 records covering 1950-2023
Precipitation
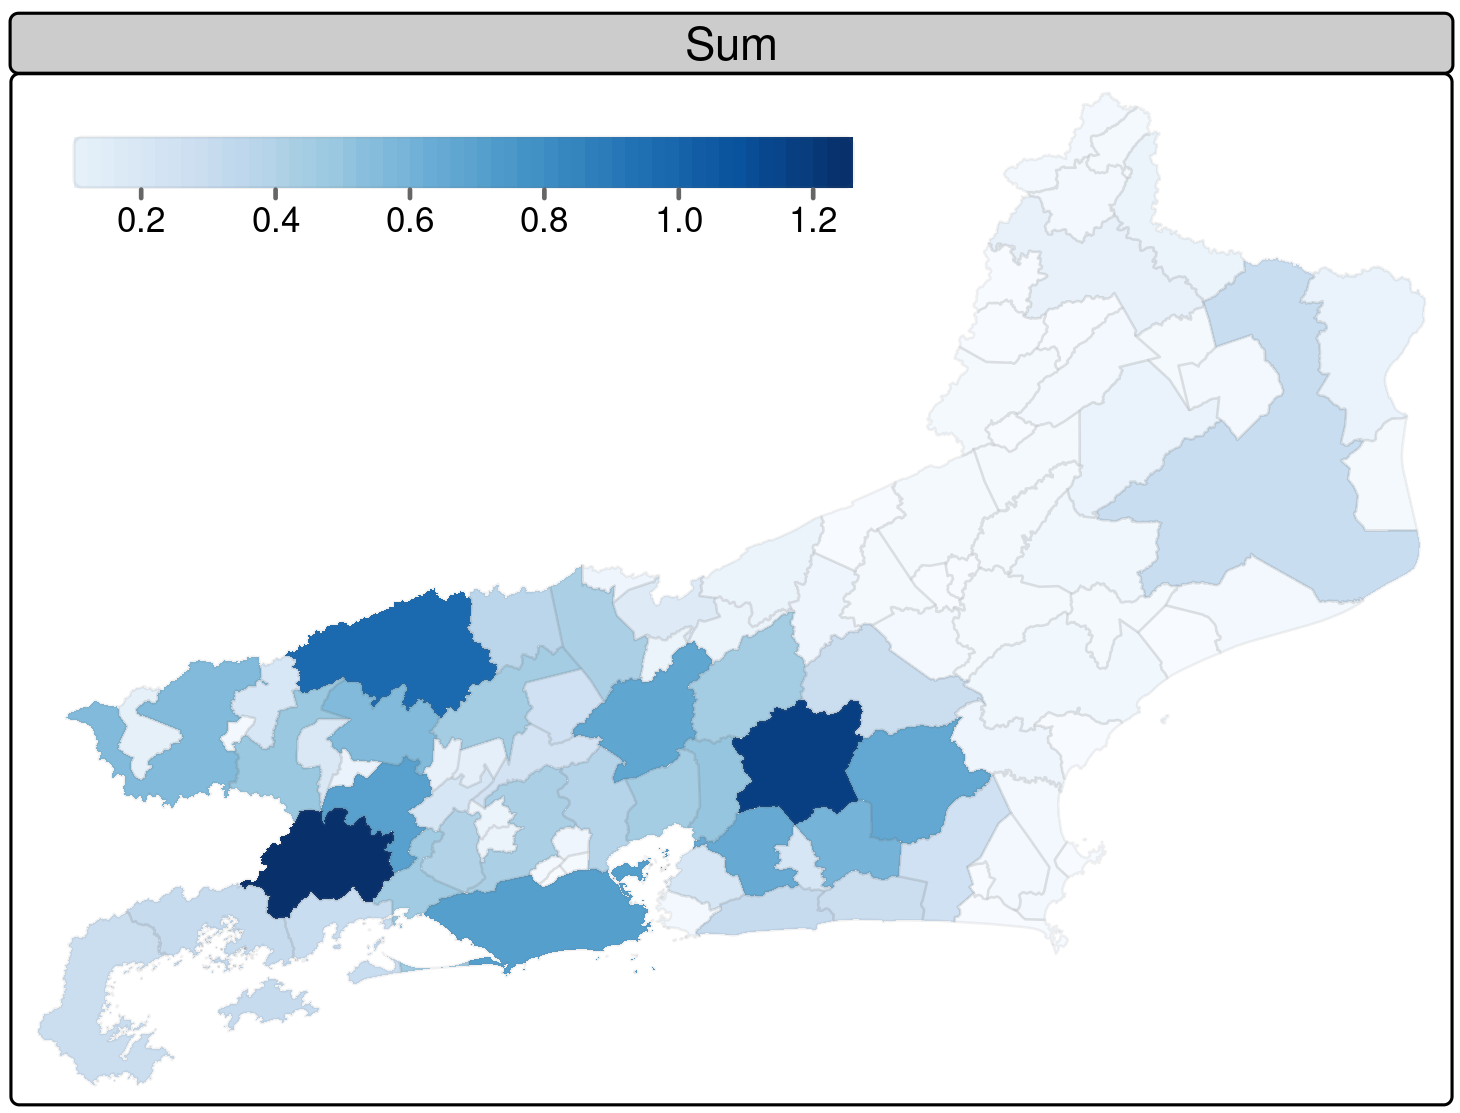

Rio de Janeiro municipalities. January 1, 2010.
Angra dos Reis

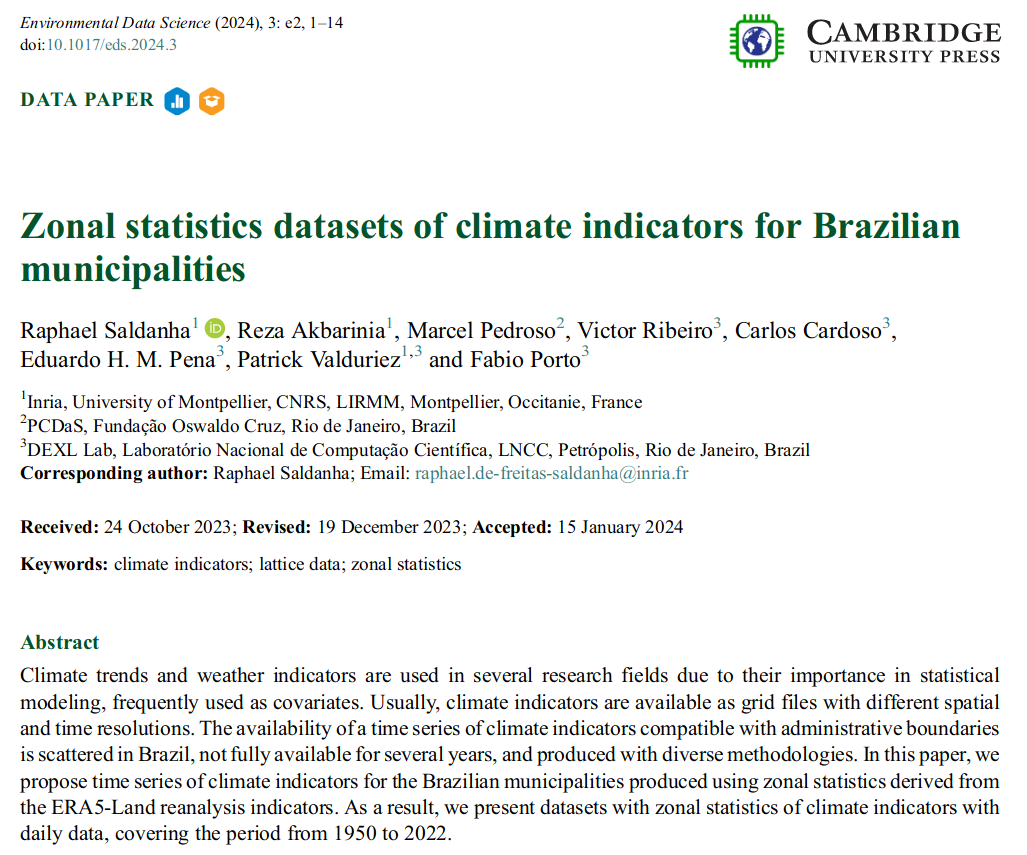
Publications & Products
- Paper on Environmental Data Science journal (Saldanha et al. 2024)
- Datasets on Zenodo: more than 34,000 downloads
- brclimr package to retrieve climate data of Brazilian municipalities, Almost 4,000 downloads on CRAN.
![]()
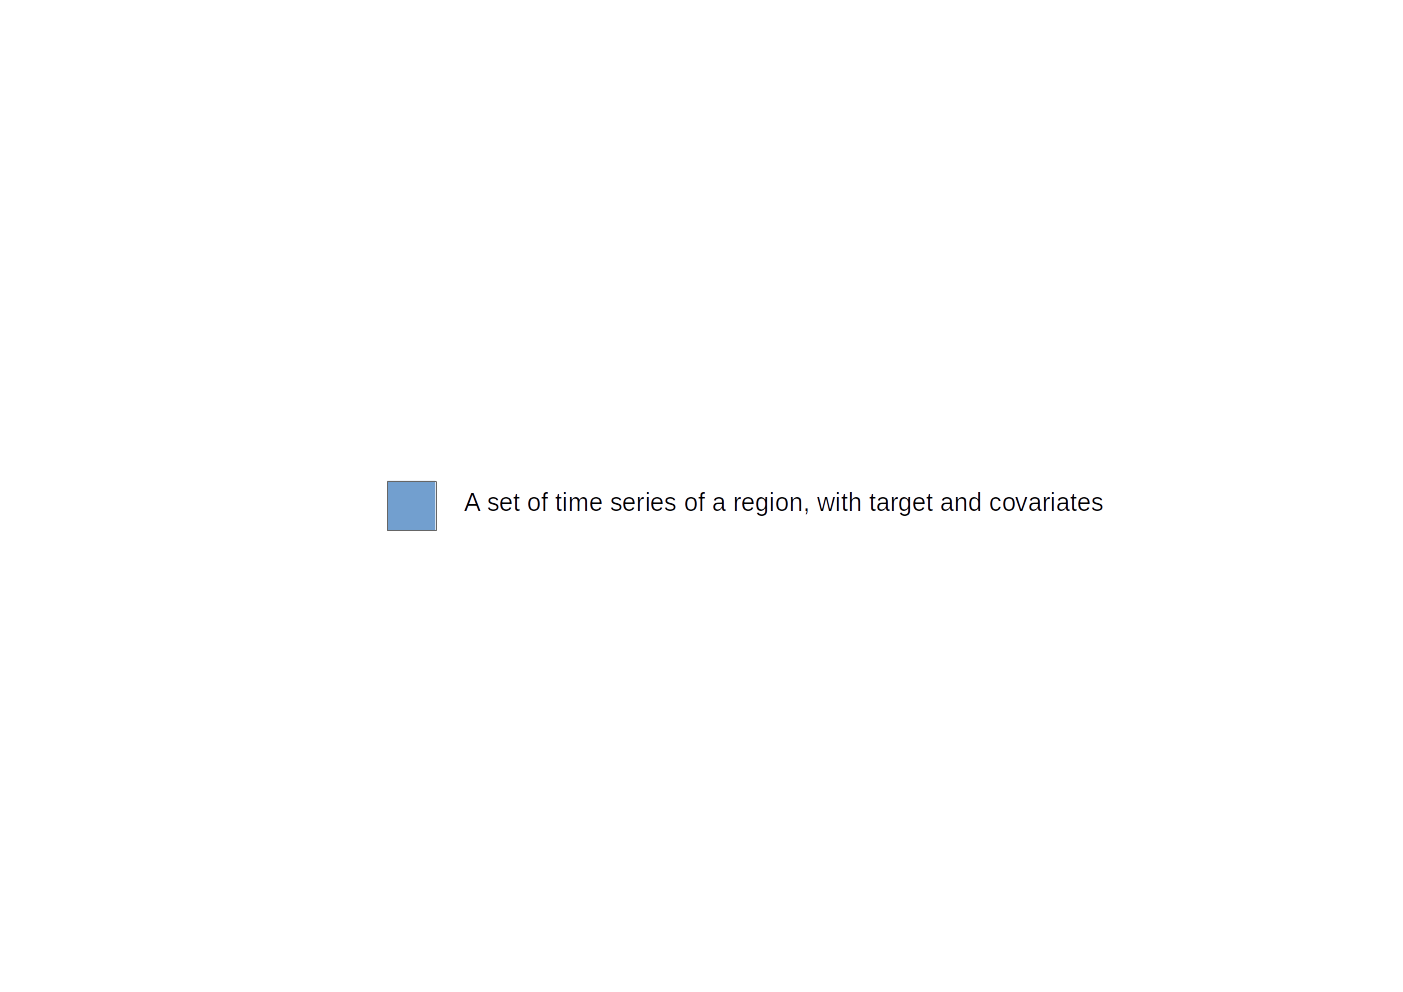
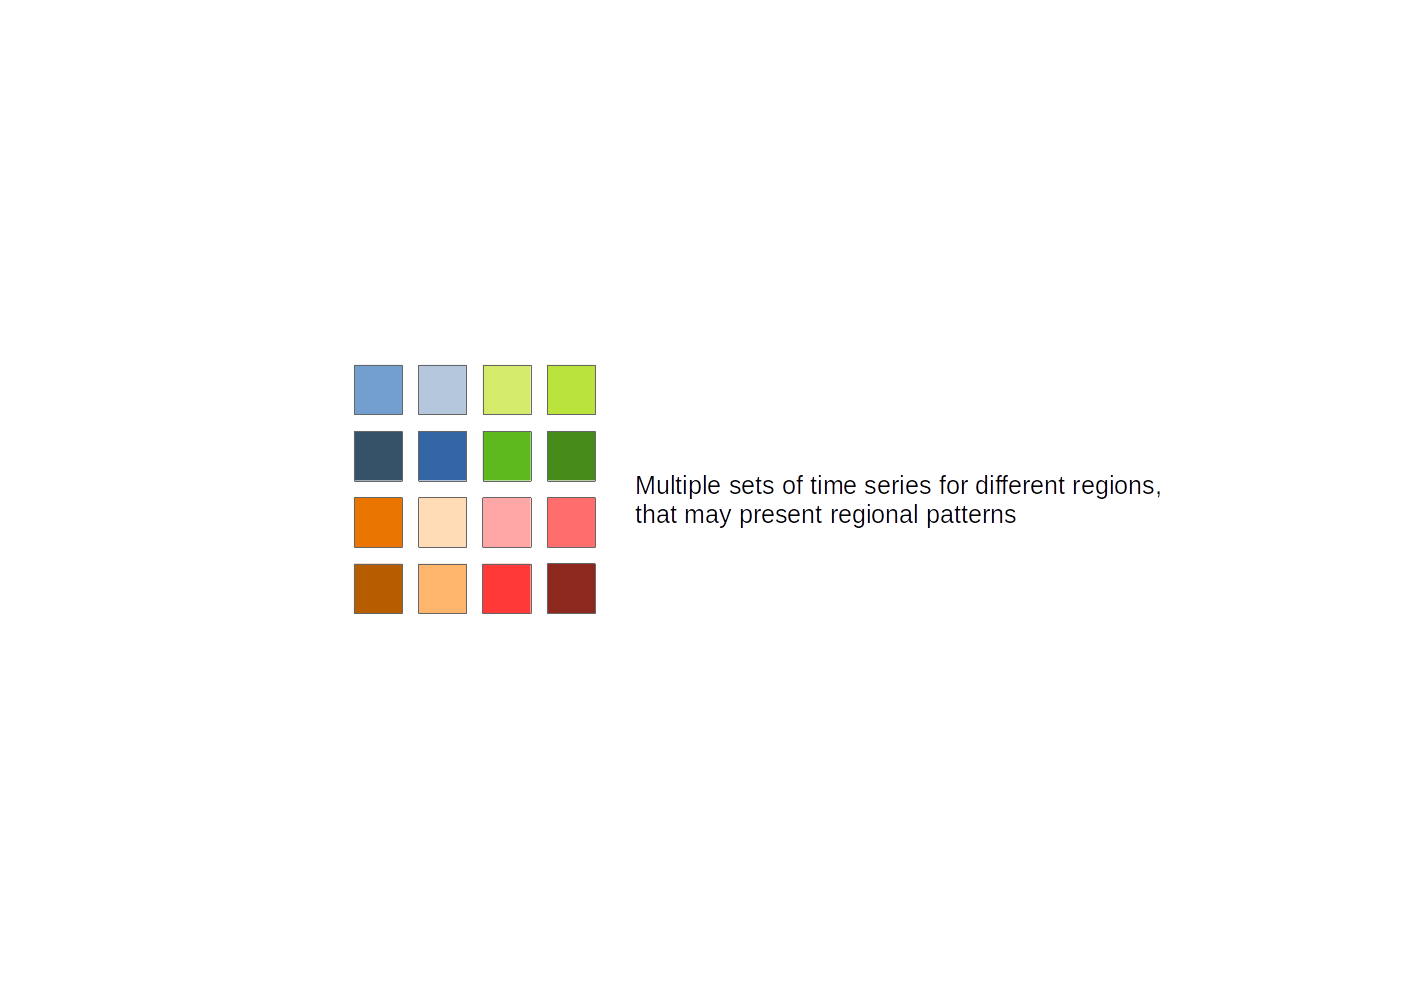
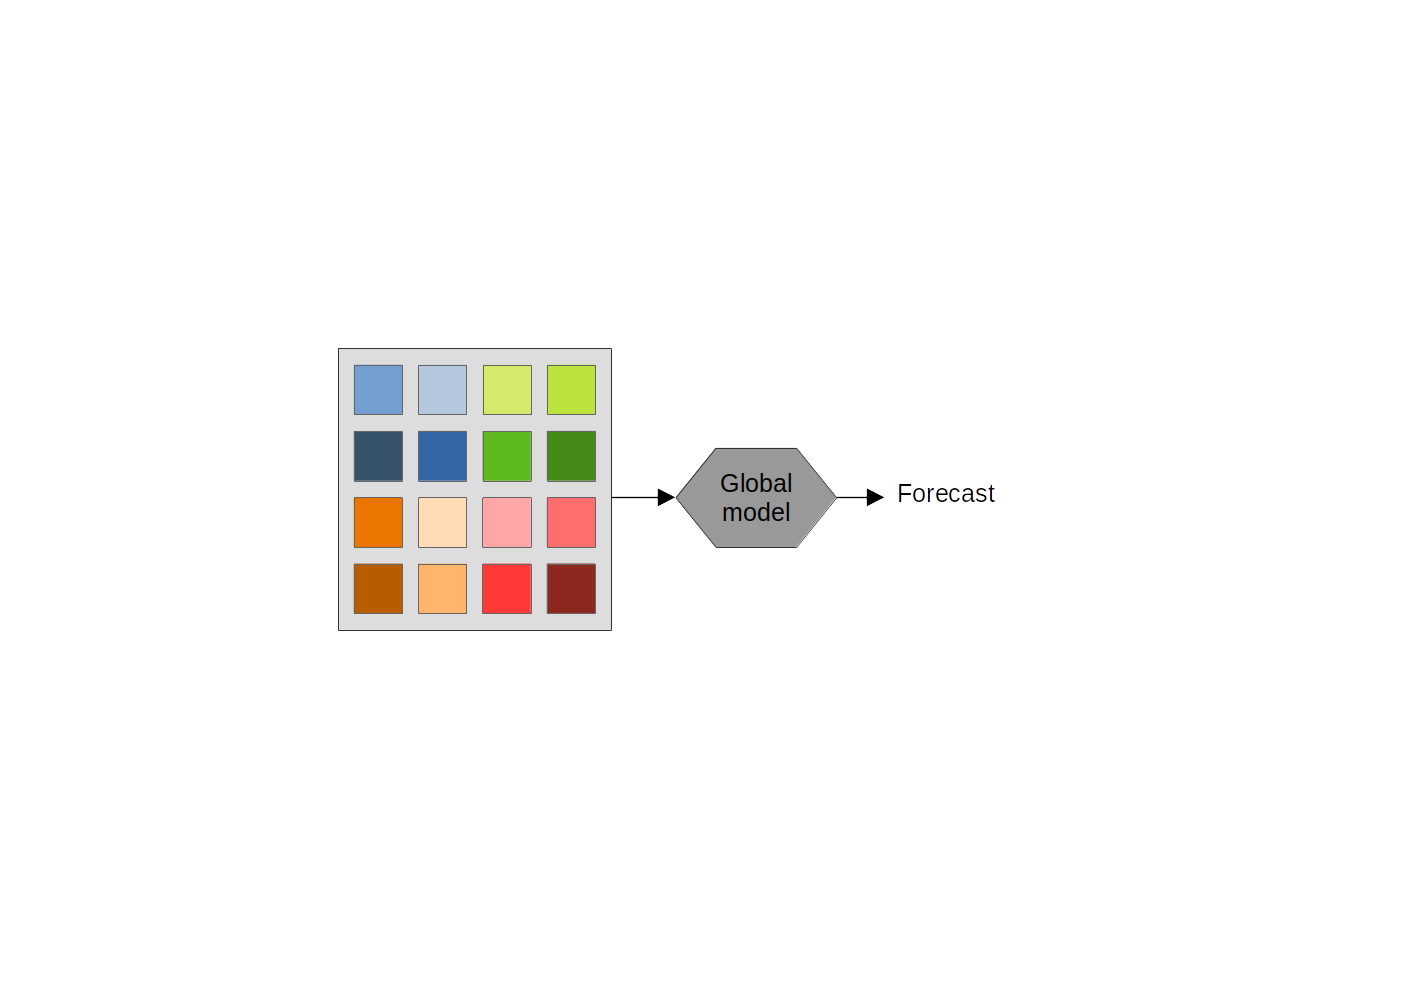
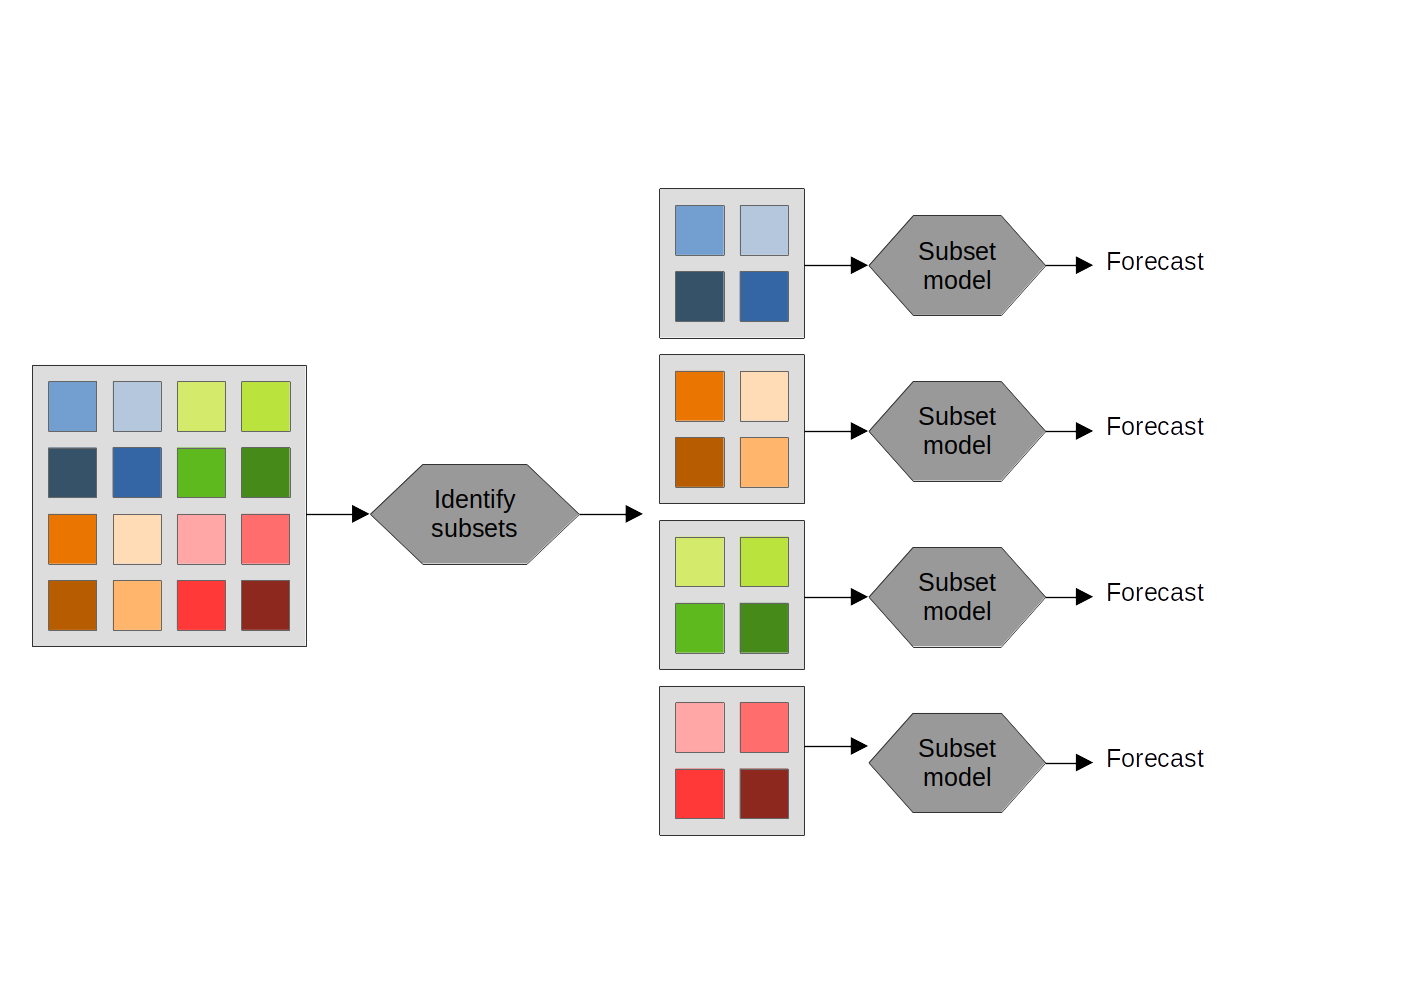
Subset models for multivariate time series forecast
- Data may present intrinsic diversity of samples, affecting model’s performance on different parts of the input
- Global models: use all available time series
- Local models: use only time series pertaining to each sample
- Data subsets models: our proposal
- Paper on ICDE2024, Multivariate Time Series Analytics workshop
![]()

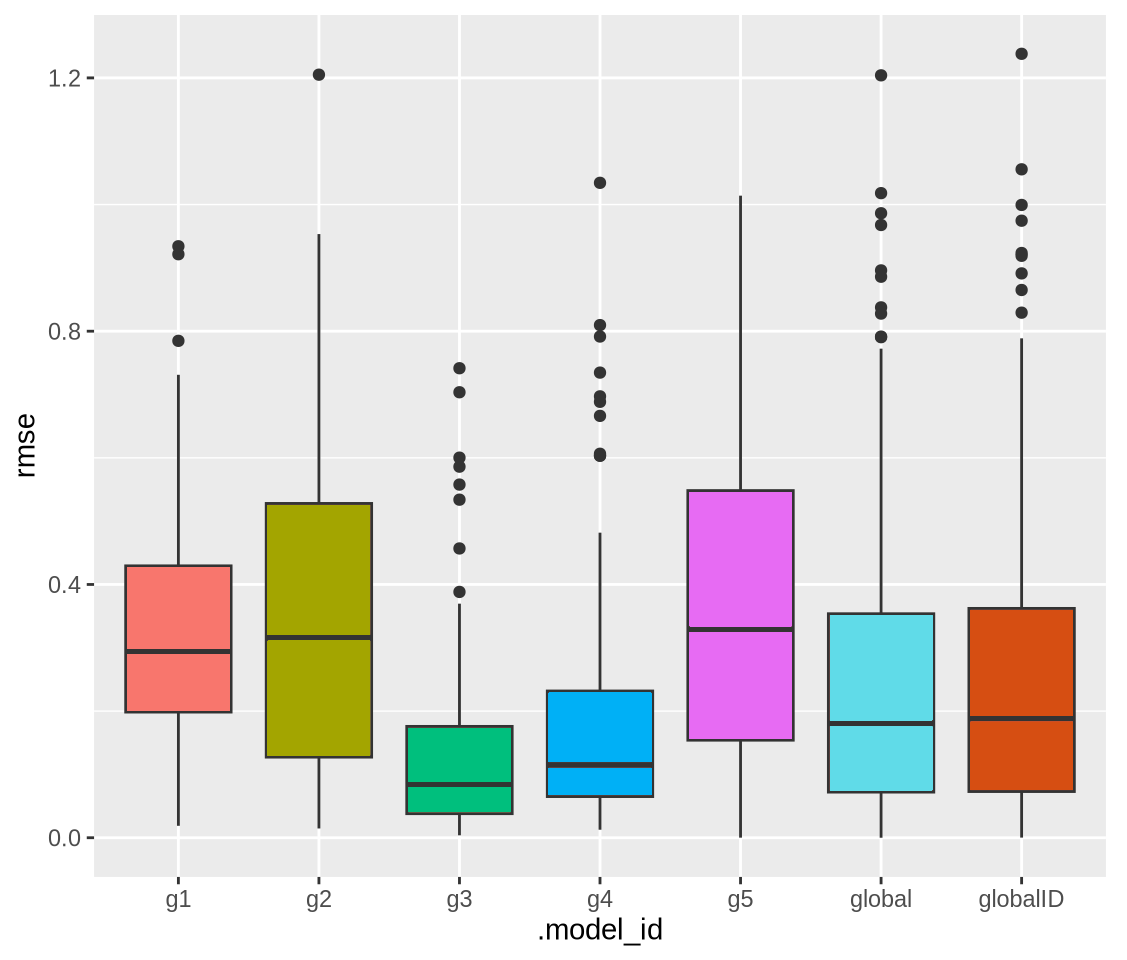
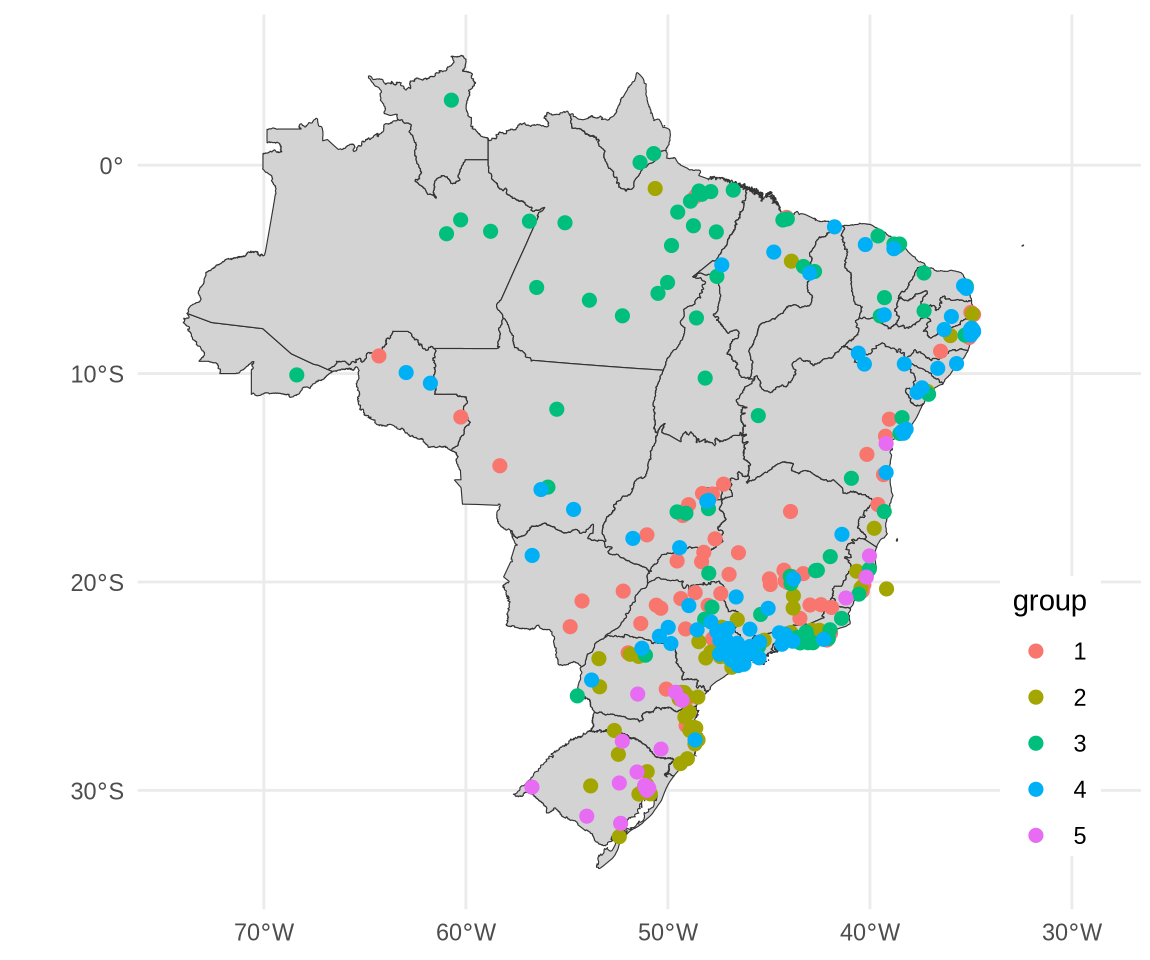
Clustering results
- \(k = 5\) returned the highest silhouette score
- Partition sizes: \(g_1 = 69\), \(g_2 = 62\), \(g_3 = 82\), \(g_4 = 102\), \(g_5 = 18\)
Model results