%%{
  init: {
    'theme': 'base',
    'themeVariables': {
      'fontSize': '30px'
    }
  }
}%%
flowchart LR

climate(Climate) --> vector(Disease vectors) --> health(Human health)
climate --> health
climate --> social(Social & economic \n determinants) --> health
Disease and climate data fusion for modelling
An application case for Brazil
2023-11-22
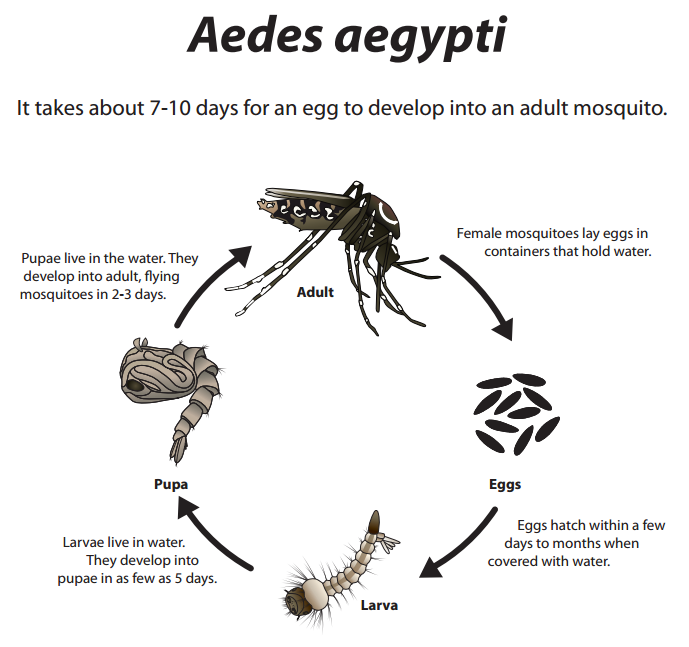
A time-lagged relationship
- Vector life cycle in a time perspective
- Climate conditions from the past leads to the disease incidence of today
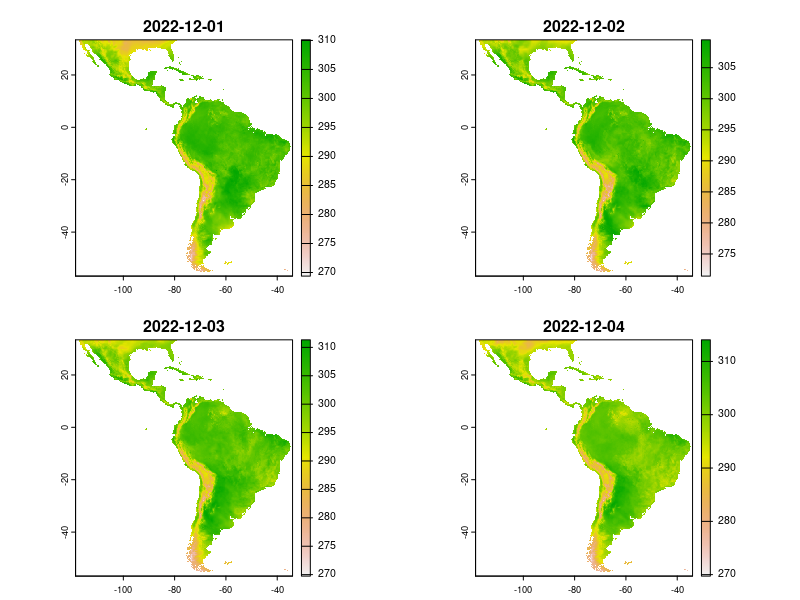
ERA5-Land reanalysis
- Copernicus, ECMWF
- Global coverage
- Hourly data
- 1950 to the present (one week lag)
- Spatial resolution ~9km
- Several climate indicators
Data structures
- Climate indicators: grid data
- Disease incidence: tabular, individual cases aggregated by spatial regions and time spans

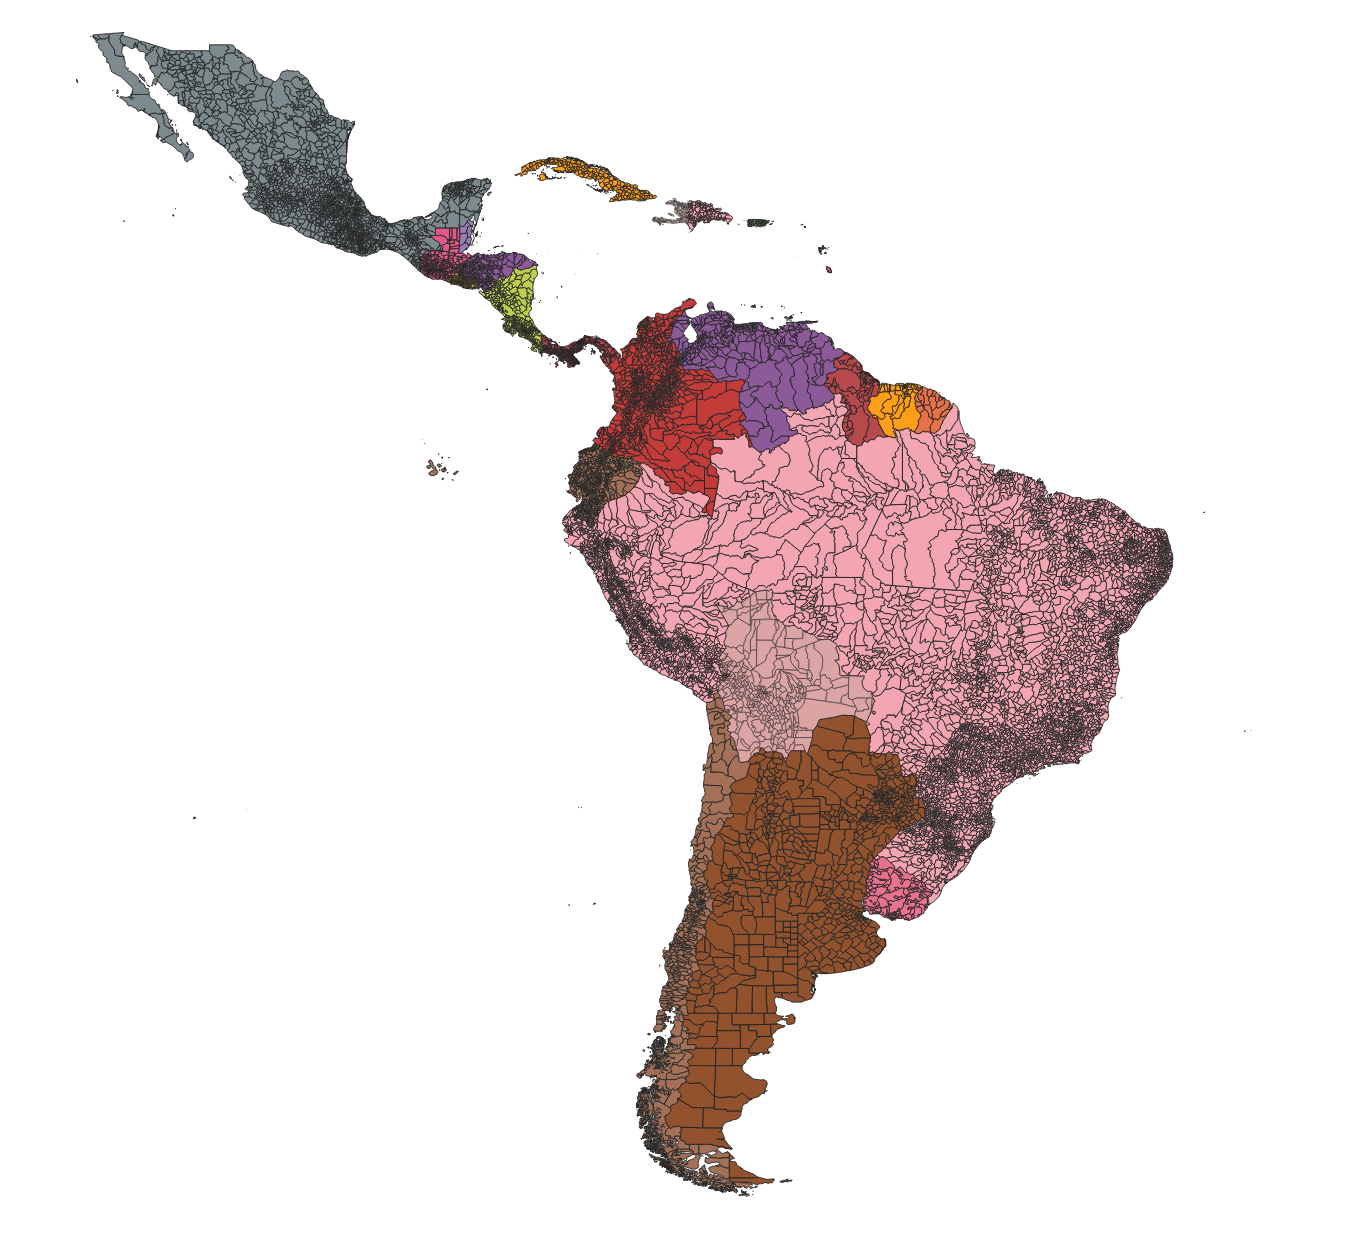
Fusioning data
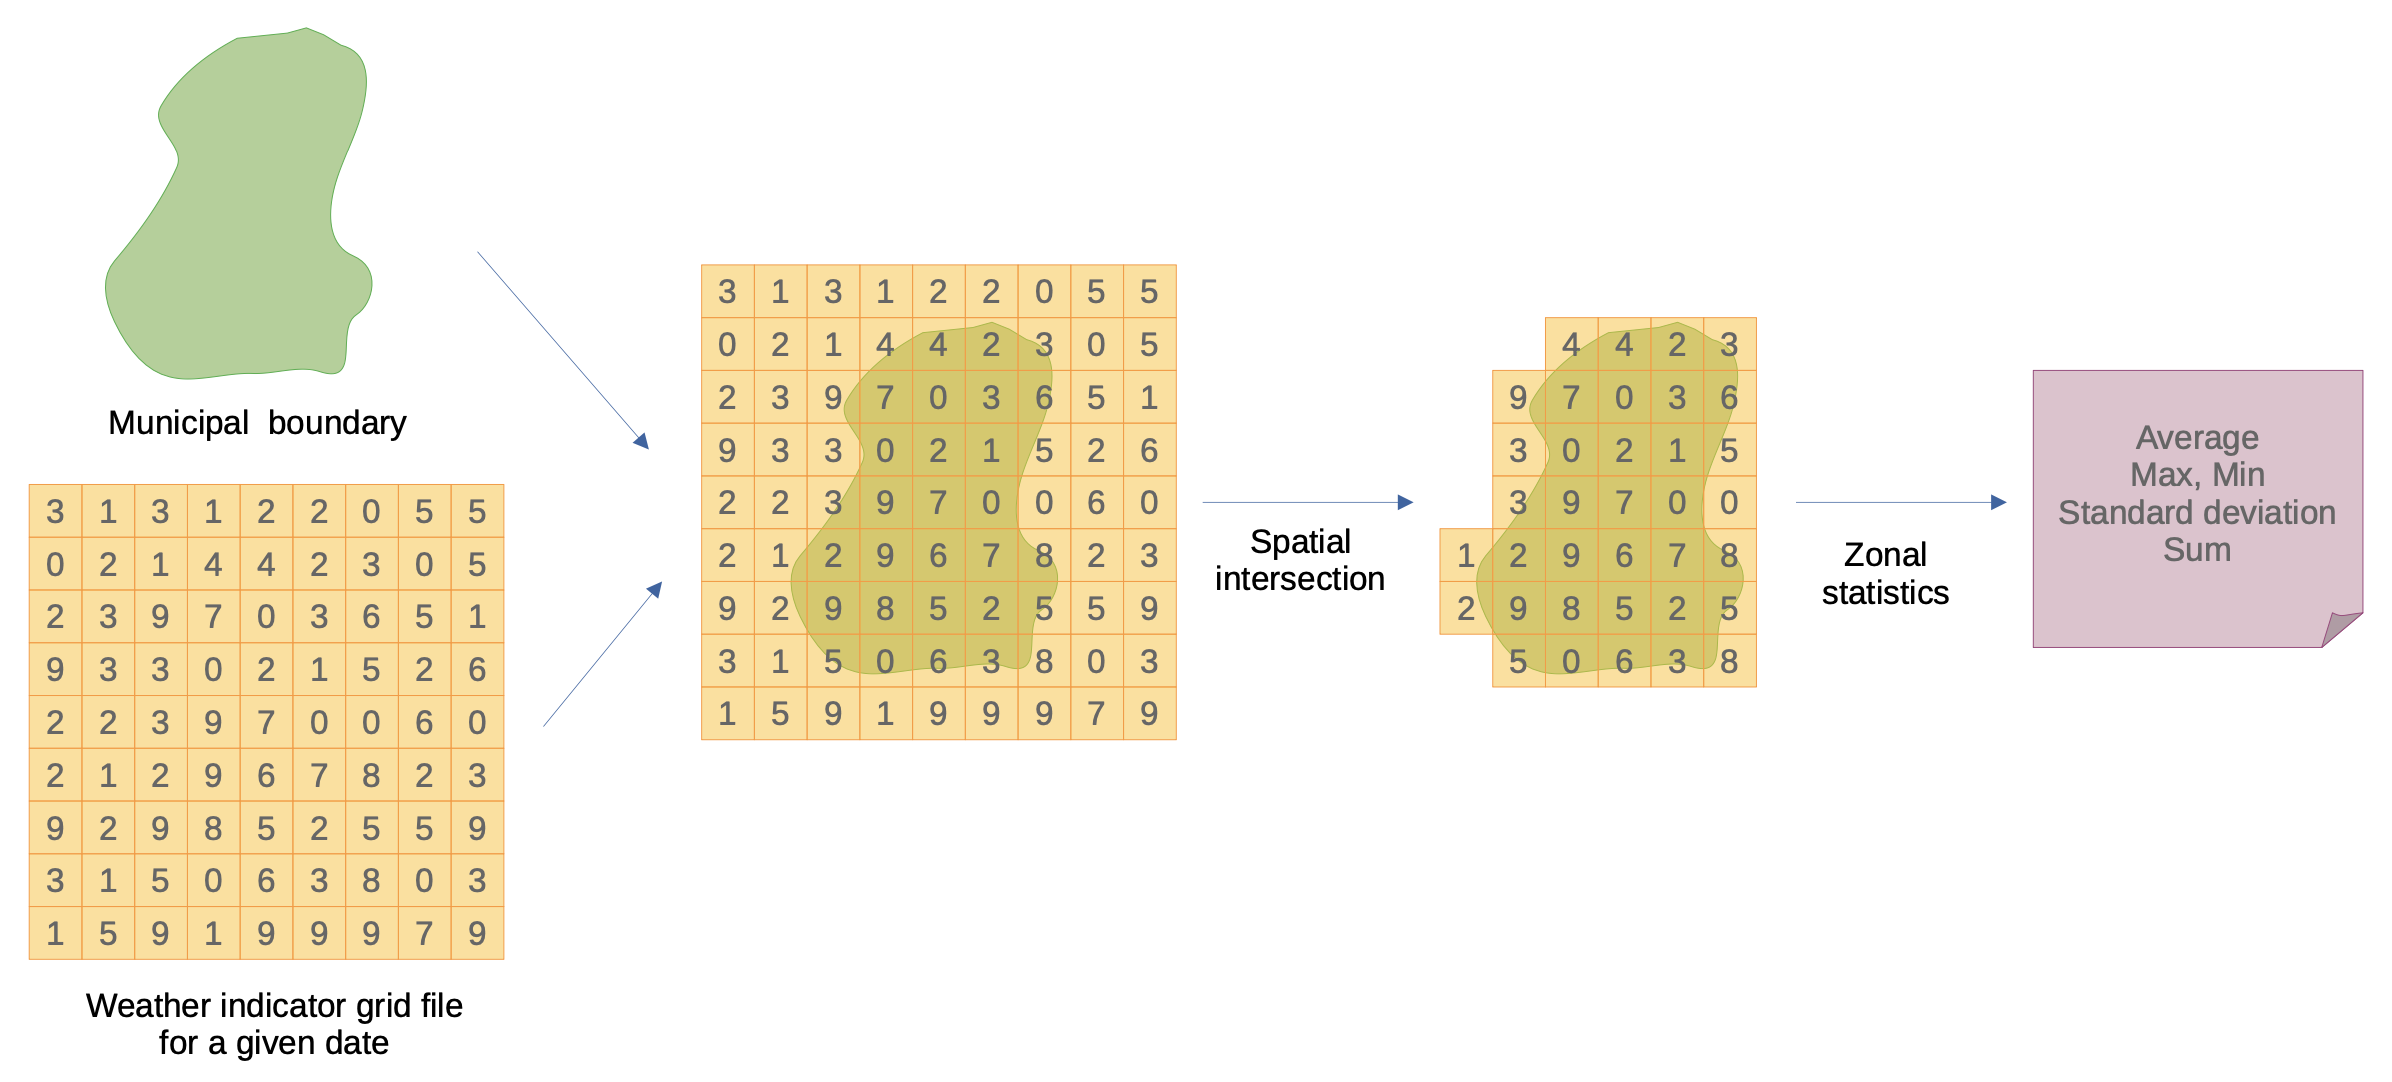
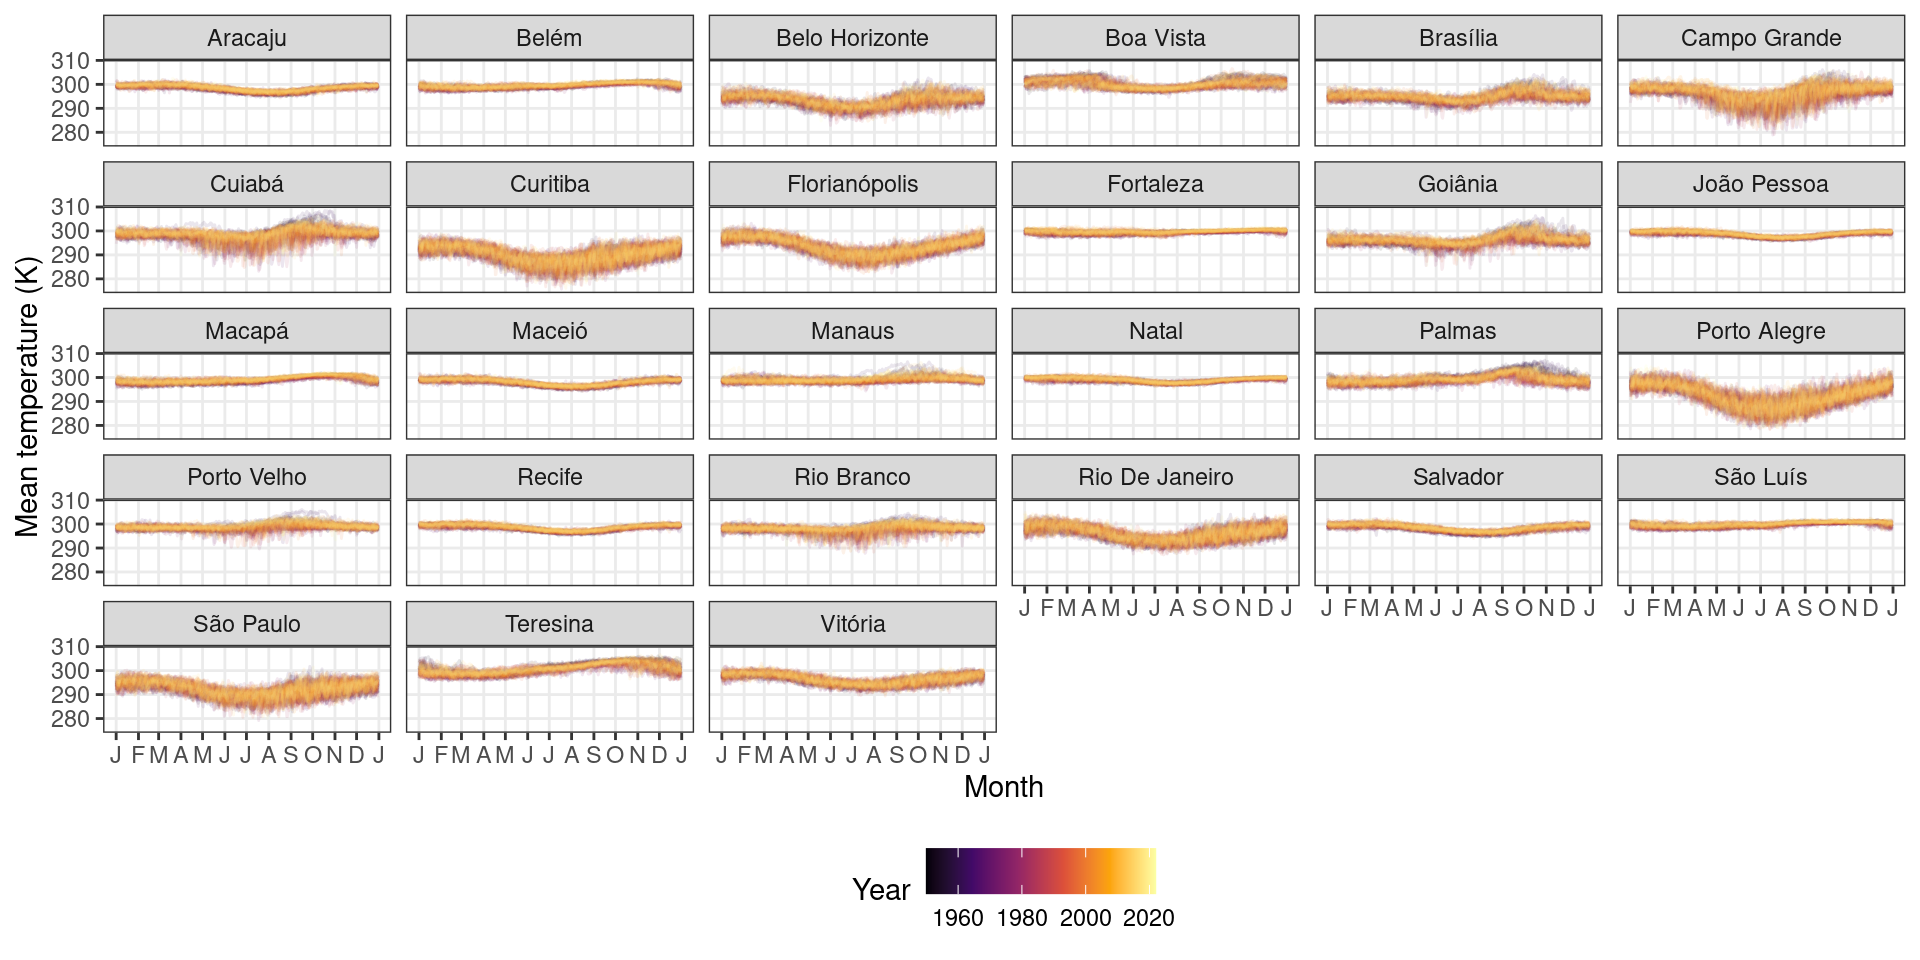
Average temperature