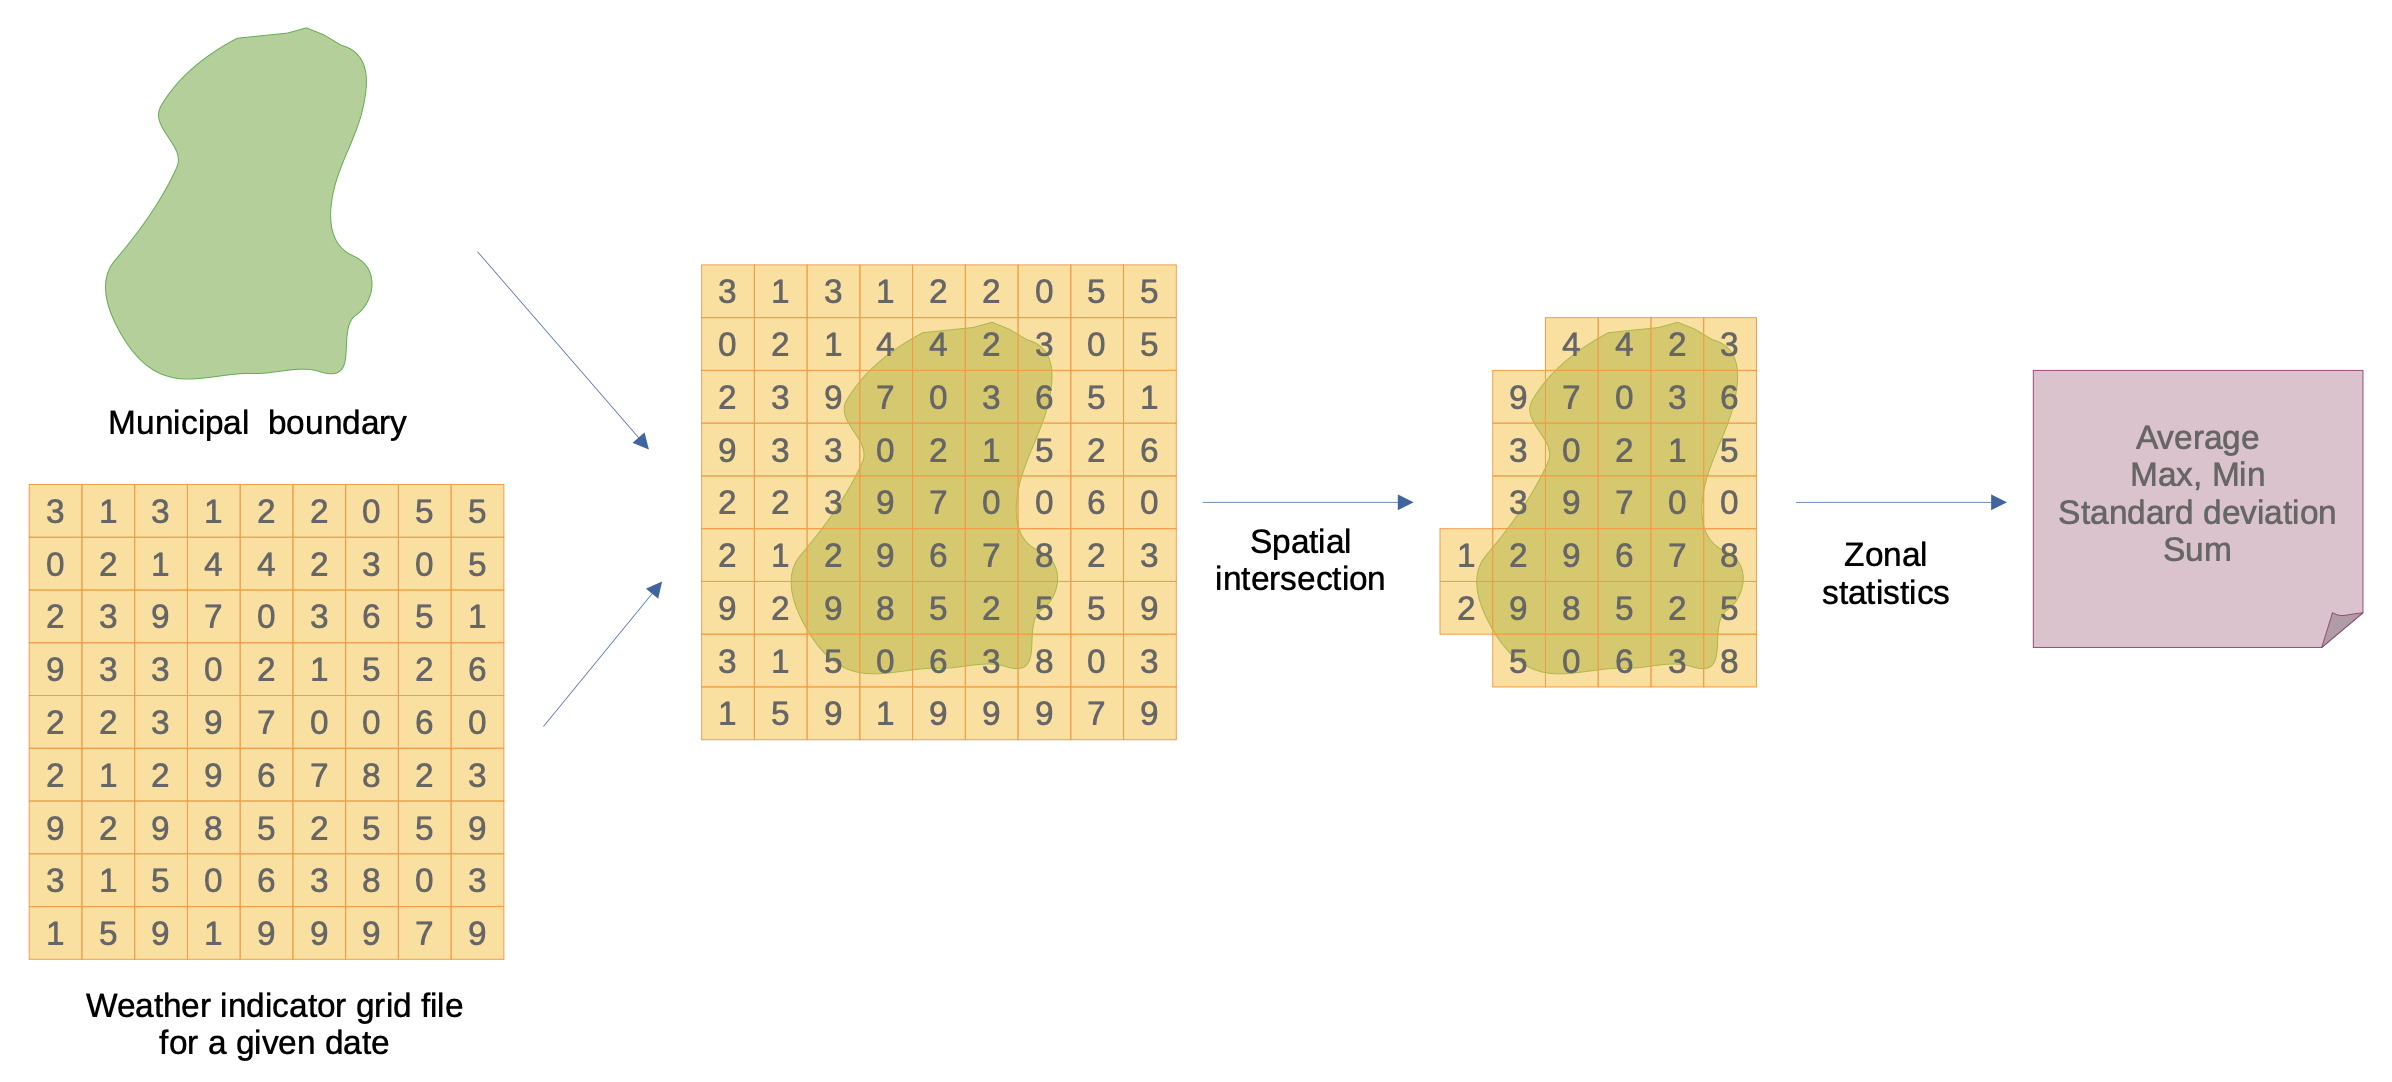
The objective of this project is to retrieve data from datasets of statistics of weather variables for Brazilian municipalities. These datasets were created by using zonal statistics.
Zonal statistics are descriptive statistics calculated using a set of cells that spatially intersects a given spatial boundary. For each boundary in a map, statistics like average, maximum value, minimum value, standard deviation, and sum are obtained to represent the cell’s values that intersect the boundary.
The Brazilian municipality boundaries from 2010 were used as a reference, as provided by the geobr package.
Thus, for each municipality, a set of zonal statistics of weather indicators is calculated, at the same time resolution of the source dataset.
Those datasets are available as parquet files on S3 buckets and queried by this project functions to retrieve data for a given municipality, dates, weather indicators, and desired zonal statistics.
BR-DWGD
Xavier, A. C., Scanlon, B. R., King, C. W., & Alves, A. I. (2022). New improved Brazilian daily weather gridded data (1961–2020). International Journal of Climatology. https://doi.org/10.1002/joc.7731
The BR-DWGD dataset presents daily meteorological data interpolated to a grid with 0.1° \(\times\) 0.1° of spatial resolution for the Brazilian territory, with daily data from January 1, 1961, to July 31, 2020. It used data from 1,252 weather stations and 11,473 rain gauges in its interpolation methods, cross-validated to the selection of the best method for each weather indicator.
The following weather indicators are available from the BR-DWGD study: precipitation (mm), minimum temperature (°C), maximum temperature (°C), solar radiation (\(MJ\cdot m^{-2}\)), wind speed at 2m height (\(m\cdot s^{-1}\)) and relative humidity (%).
brclimr::product_info(product = "brdwgd")
#> <list>
#> ├─tmax: <list>
#> │ ├─link: "https://brdwgd.nyc3.cdn.digitalo..."
#> │ ├─name: "Maximum temperature"
#> │ ├─unit: "°C"
#> │ ├─date_range: "Daily, 1961-01-01 to 2020-07-31"
#> │ └─stats: <list>
#> │   ├─min: "Tmax_min"
#> │   ├─max: "Tmax_max"
#> │   ├─mean: "Tmax_mean"
#> │   └─sd: "Tmax_sd"
#> ├─tmin: <list>
#> │ ├─link: "https://brdwgd.nyc3.cdn.digitalo..."
#> │ ├─name: "Minimum temperature"
#> │ ├─unit: "°C"
#> │ ├─date_range: "Daily, 1961-01-01 to 2020-07-31"
#> │ └─stats: <list>
#> │   ├─min: "Tmin_min"
#> │   ├─max: "Tmin_max"
#> │   ├─mean: "Tmin_mean"
#> │   └─sd: "Tmin_sd"
#> ├─pr: <list>
#> │ ├─link: "https://brdwgd.nyc3.cdn.digitalo..."
#> │ ├─name: "Precipitation"
#> │ ├─unit: "mm"
#> │ ├─date_range: "Daily, 1961-01-01 to 2020-07-31"
#> │ └─stats: <list>
#> │   ├─min: "pr_min"
#> │   ├─max: "pr_max"
#> │   ├─mean: "pr_mean"
#> │   ├─sd: "pr_sd"
#> │   └─sum: "pr_sum"
#> ├─eto: <list>
#> │ ├─link: "https://brdwgd.nyc3.cdn.digitalo..."
#> │ ├─name: "Evapotranspiration"
#> │ ├─unit: "mm"
#> │ ├─date_range: "Daily, 1961-01-01 to 2020-07-31"
#> │ └─stats: <list>
#> │   ├─min: "ETo_min"
#> │   ├─max: "ETo_max"
#> │   ├─mean: "ETo_mean"
#> │   ├─sd: "ETo_sd"
#> │   └─sum: "ETo_sd"
#> ├─rh: <list>
#> │ ├─link: "https://brdwgd.nyc3.cdn.digitalo..."
#> │ ├─name: "Relative humidity"
#> │ ├─unit: "%"
#> │ ├─date_range: "Daily, 1961-01-01 to 2020-07-31"
#> │ └─stats: <list>
#> │   ├─min: "RH_min"
#> │   ├─max: "RH_max"
#> │   ├─mean: "RH_mean"
#> │   └─sd: "RH_sd"
#> ├─rs: <list>
#> │ ├─link: "https://brdwgd.nyc3.cdn.digitalo..."
#> │ ├─name: "Solar radiation"
#> │ ├─unit: "MJ/m2"
#> │ ├─date_range: "Daily, 1961-01-01 to 2020-07-31"
#> │ └─stats: <list>
#> │   ├─min: "Rs_min"
#> │   ├─max: "Rs_max"
#> │   ├─mean: "Rs_mean"
#> │   └─sd: "Rs_sd"
#> └─u2: <list>
#>   ├─link: "https://brdwgd.nyc3.cdn.digitalo..."
#>   ├─name: "Wind speed"
#>   ├─unit: "m/2"
#>   ├─date_range: "Daily, 1961-01-01 to 2020-07-31"
#>   └─stats: <list>
#>     ├─min: "u2_min"
#>     ├─max: "u2_max"
#>     ├─mean: "u2_mean"
#>     └─sd: "u2_sd"
TerraClimate
Abatzoglou, J. T., Dobrowski, S. Z., Parks, S. A., Hegewisch, K. C. (2018). TerraClimate, a high-resolution global dataset of monthly climate and climatic water balance from 1958-2015. Scientific Data, 5. https://doi.org/10.1038/sdata.2017.191
The TerraClimate dataset presents monthly meteorological data interpolated to a grid with 0.04° \(\times\) 0.04° (1/24th degree) of spatial resolution with world cover, with monthly data from January, 1958, to December, 2021.
The following weather indicators are available from the TerraClimate study: Actual Evapotranspiration (mm), Climate Water Deficit (mm), Potential evapotranspiration(mm), Precipitation (mm), Runoff (mm), Soil Moisture (mm), Downward surface shortwave radiation (\(W/m^2\)), Snow water equivalent (mm), Minimum temperature (°C), Maximum temperature (°C), Vapor pressure (kPa), Wind speed (\(m/s\)), Vapor Pressure Deficit (kpa) and Palmer Drought Severity Index.
brclimr::product_info(product = "terraclimate")
#> <list>
#> ├─tmax: <list>
#> │ ├─link: "https://terraclimate.nyc3.cdn.di..."
#> │ ├─name: "Maximum temperature"
#> │ ├─detail: "Average for month"
#> │ ├─unit: "°C"
#> │ ├─date_range: "Monthly, 1958-01 to 2021-12"
#> │ └─stats: <list>
#> │   ├─min: "tmax_min"
#> │   ├─max: "tmax_max"
#> │   ├─mean: "tmax_mean"
#> │   └─sd: "tmax_sd"
#> ├─tmin: <list>
#> │ ├─link: "https://terraclimate.nyc3.cdn.di..."
#> │ ├─name: "Minimum temperature"
#> │ ├─detail: "Average for month"
#> │ ├─unit: "°C"
#> │ ├─date_range: "Monthly, 1958-01 to 2021-12"
#> │ └─stats: <list>
#> │   ├─min: "tmin_min"
#> │   ├─max: "tmin_max"
#> │   ├─mean: "tmin_mean"
#> │   └─sd: "tmin_sd"
#> ├─ppt: <list>
#> │ ├─link: "https://terraclimate.nyc3.cdn.di..."
#> │ ├─name: "Precipitation"
#> │ ├─detail: "Monthly total"
#> │ ├─unit: "mm"
#> │ ├─date_range: "Monthly, 1958-01 to 2021-12"
#> │ └─stats: <list>
#> │   ├─min: "ppt_min"
#> │   ├─max: "ppt_max"
#> │   ├─mean: "ppt_mean"
#> │   ├─sd: "ppt_sd"
#> │   └─sum: "ppt_sum"
#> ├─aet: <list>
#> │ ├─link: "https://terraclimate.nyc3.cdn.di..."
#> │ ├─name: "Actual Evapotranspiration"
#> │ ├─detail: "Monthly total"
#> │ ├─unit: "mm"
#> │ ├─date_range: "Monthly, 1958-01 to 2021-12"
#> │ └─stats: <list>
#> │   ├─min: "aet_min"
#> │   ├─max: "aet_max"
#> │   ├─mean: "aet_mean"
#> │   ├─sd: "aet_sd"
#> │   └─sum: "aet_sum"
#> ├─def: <list>
#> │ ├─link: "https://terraclimate.nyc3.cdn.di..."
#> │ ├─name: "Climate Water Deficit"
#> │ ├─detail: "Monthly total"
#> │ ├─unit: "mm"
#> │ ├─date_range: "Monthly, 1958-01 to 2021-12"
#> │ └─stats: <list>
#> │   ├─min: "def_min"
#> │   ├─max: "def_max"
#> │   ├─mean: "def_mean"
#> │   ├─sd: "def_sd"
#> │   └─sum: "def_sum"
#> ├─pdsi: <list>
#> │ ├─link: "https://terraclimate.nyc3.cdn.di..."
#> │ ├─name: "Palmer Drought Severity Index"
#> │ ├─detail: "At end of month"
#> │ ├─unit: "unitless"
#> │ ├─date_range: "Monthly, 1958-01 to 2021-12"
#> │ └─stats: <list>
#> │   ├─min: "PDSI_min"
#> │   ├─max: "PDSI_max"
#> │   ├─mean: "PDSI_mean"
#> │   └─sd: "PDSI_sd"
#> ├─pet: <list>
#> │ ├─link: "https://terraclimate.nyc3.cdn.di..."
#> │ ├─name: "Potential evapotranspiration"
#> │ ├─detail: "Monthly total"
#> │ ├─unit: "mm"
#> │ ├─date_range: "Monthly, 1958-01 to 2021-12"
#> │ └─stats: <list>
#> │   ├─min: "pet_min"
#> │   ├─max: "pet_max"
#> │   ├─mean: "pet_mean"
#> │   ├─sd: "pet_sd"
#> │   └─sum: "pet_sum"
#> ├─q: <list>
#> │ ├─link: "https://terraclimate.nyc3.cdn.di..."
#> │ ├─name: "Runoff"
#> │ ├─detail: "Monthly total"
#> │ ├─unit: "mm"
#> │ ├─date_range: "Monthly, 1958-01 to 2021-12"
#> │ └─stats: <list>
#> │   ├─min: "q_min"
#> │   ├─max: "q_max"
#> │   ├─mean: "q_mean"
#> │   ├─sd: "q_sd"
#> │   └─sum: "q_sum"
#> ├─soil: <list>
#> │ ├─link: "https://terraclimate.nyc3.cdn.di..."
#> │ ├─name: "Soil Moisture"
#> │ ├─detail: "Total column, at end of month"
#> │ ├─unit: "mm"
#> │ ├─date_range: "Monthly, 1958-01 to 2021-12"
#> │ └─stats: <list>
#> │   ├─min: "soil_min"
#> │   ├─max: "soil_max"
#> │   ├─mean: "soil_mean"
#> │   ├─sd: "soil_sd"
#> │   └─sum: "soil_sum"
#> ├─srad: <list>
#> │ ├─link: "https://terraclimate.nyc3.cdn.di..."
#> │ ├─name: "Downward surface shortwave radia..."
#> │ ├─unit: "W/m2"
#> │ ├─date_range: "Monthly, 1958-01 to 2021-12"
#> │ └─stats: <list>
#> │   ├─min: "srad_min"
#> │   ├─max: "srad_max"
#> │   ├─mean: "srad_mean"
#> │   ├─sd: "srad_sd"
#> │   └─sum: "srad_sum"
#> ├─swe: <list>
#> │ ├─link: "https://terraclimate.nyc3.cdn.di..."
#> │ ├─name: "Snow water equivalent"
#> │ ├─detail: "At end of month"
#> │ ├─unit: "mm"
#> │ ├─date_range: "Monthly, 1958-01 to 2021-12"
#> │ └─stats: <list>
#> │   ├─min: "swe_min"
#> │   ├─max: "swe_max"
#> │   ├─mean: "swe_mean"
#> │   ├─sd: "swe_sd"
#> │   └─sum: "swe_sum"
#> ├─vap: <list>
#> │ ├─link: "https://terraclimate.nyc3.cdn.di..."
#> │ ├─name: "Vapor pressure"
#> │ ├─detail: "Average for month"
#> │ ├─unit: "kPa"
#> │ ├─date_range: "Monthly, 1958-01 to 2021-12"
#> │ └─stats: <list>
#> │   ├─min: "vap_min"
#> │   ├─max: "vap_max"
#> │   ├─mean: "vap_mean"
#> │   └─sd: "vap_sd"
#> ├─vpd: <list>
#> │ ├─link: "https://terraclimate.nyc3.cdn.di..."
#> │ ├─name: "Vapor Pressure Deficit"
#> │ ├─detail: "Average for month"
#> │ ├─unit: "kPa"
#> │ ├─date_range: "Monthly, 1958-01 to 2021-12"
#> │ └─stats: <list>
#> │   ├─min: "vpd_min"
#> │   ├─max: "vpd_max"
#> │   ├─mean: "vpd_mean"
#> │   └─sd: "vpd_sd"
#> └─ws: <list>
#>   ├─link: "https://terraclimate.nyc3.cdn.di..."
#>   ├─name: "Wind speed"
#>   ├─detail: "Average for month"
#>   ├─unit: "m/s"
#>   ├─date_range: "Monthly, 1958-01 to 2021-12"
#>   └─stats: <list>
#>     ├─min: "ws_min"
#>     ├─max: "ws_max"
#>     ├─mean: "ws_mean"
#>     └─sd: "ws_sd"