Climate data for Brazilian municipalities
Raphael Saldanha et al.
Fiocruz
2024-11-20
Overview
- Climate raw data sources: ground level and reanalysis
- Data on Braziliam municipalities spatial unit
- Climatological normals and indicators
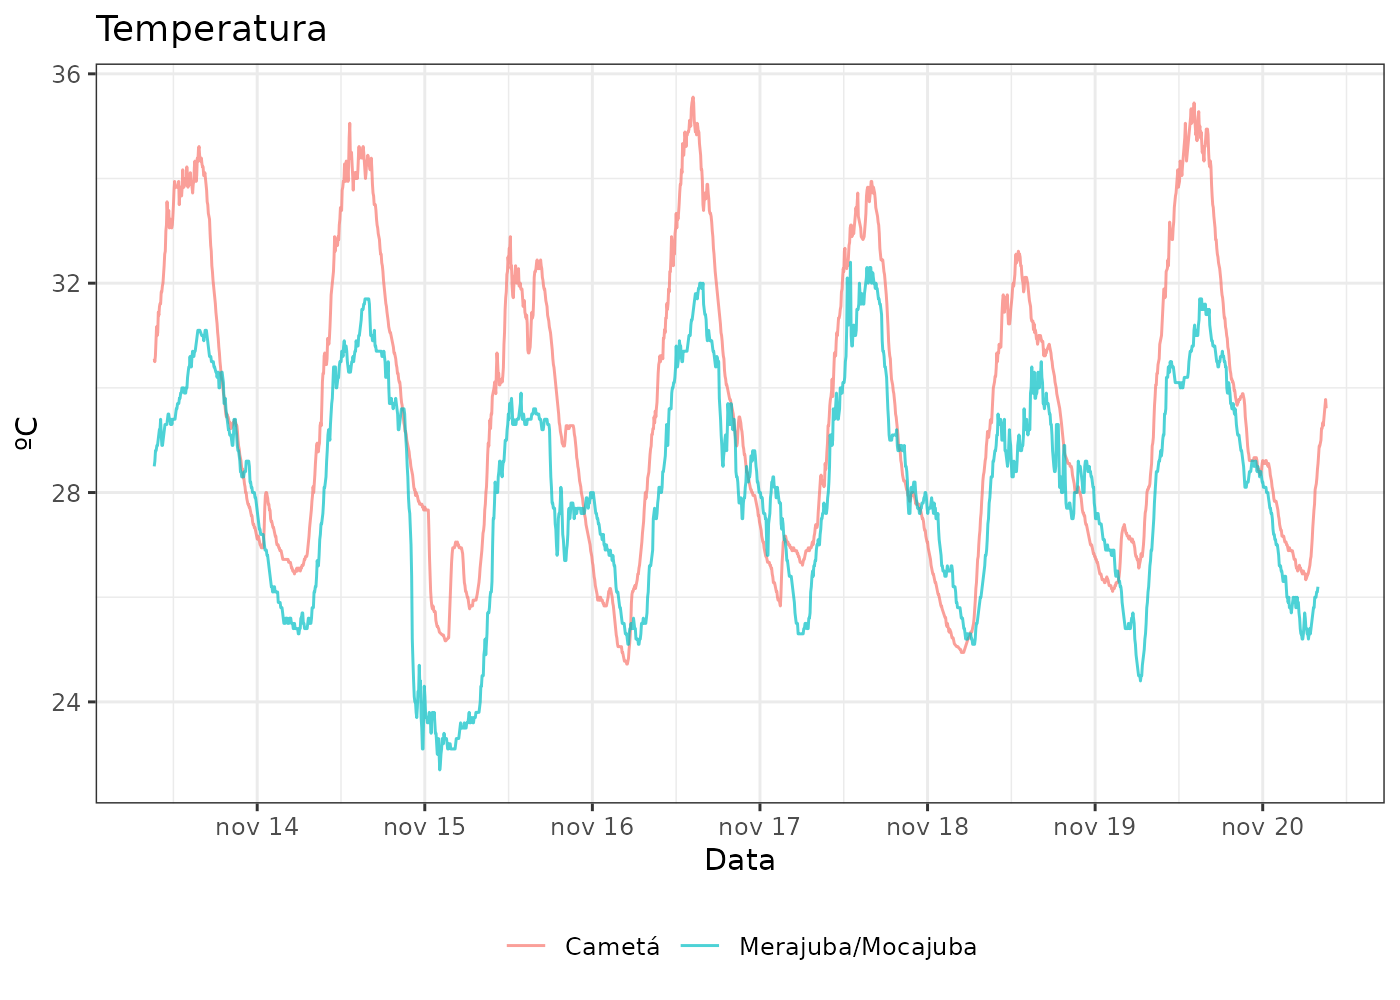
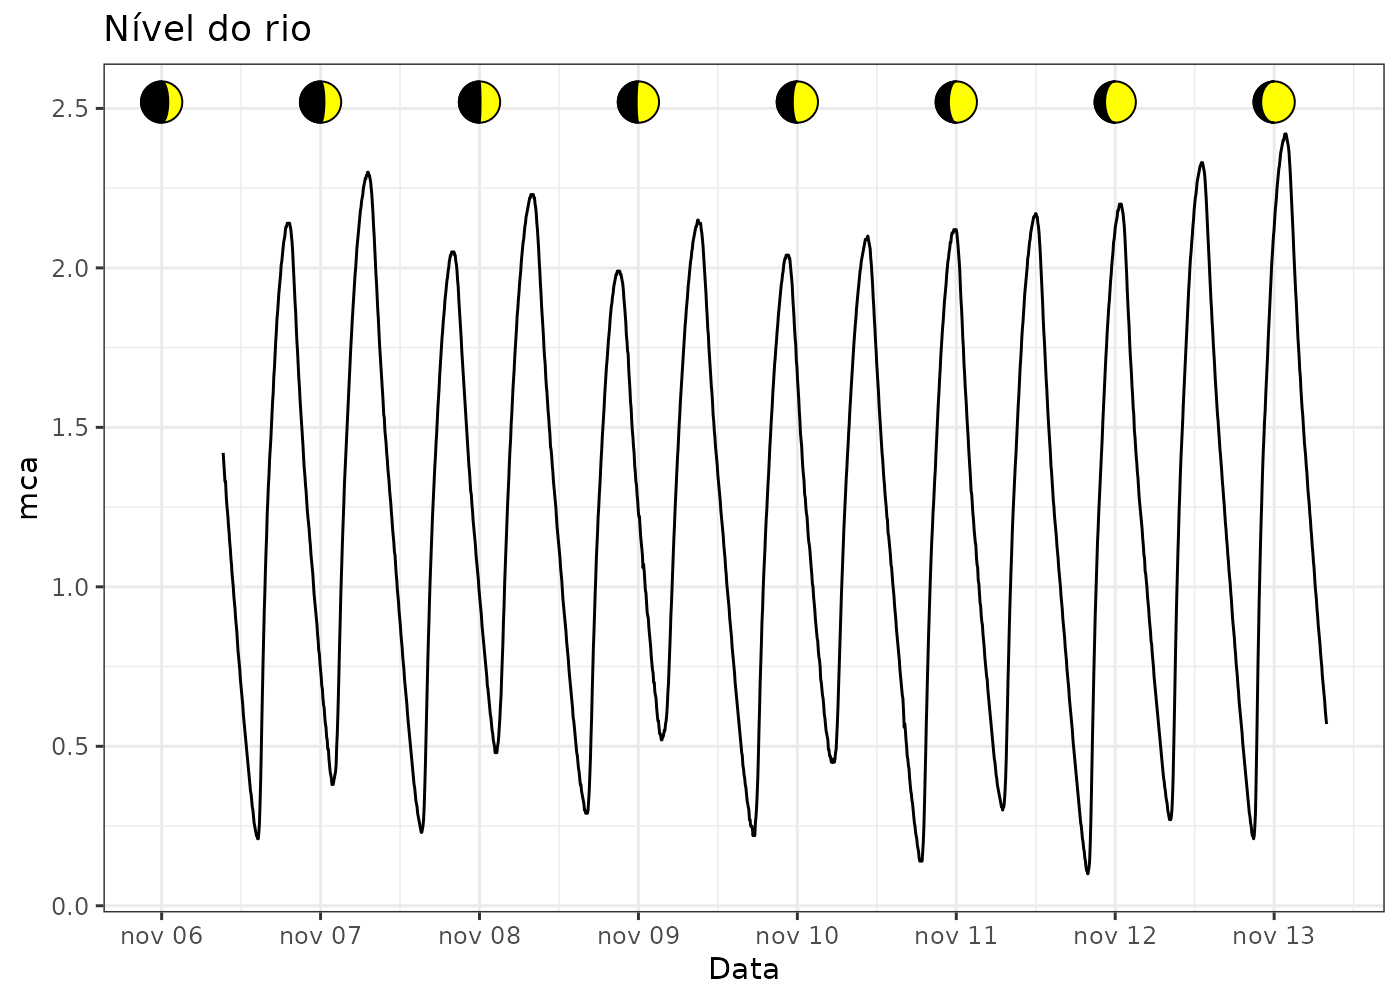
Ground-level climate data
- Weather stations on Cametá and Mocajuba (north region)
- Data every 5 minutes, sent to Fiocruz Postgres server
-
plugfieldapi package to retrieve data from stations with daily e-mail reports
- Error detection and notification for problems
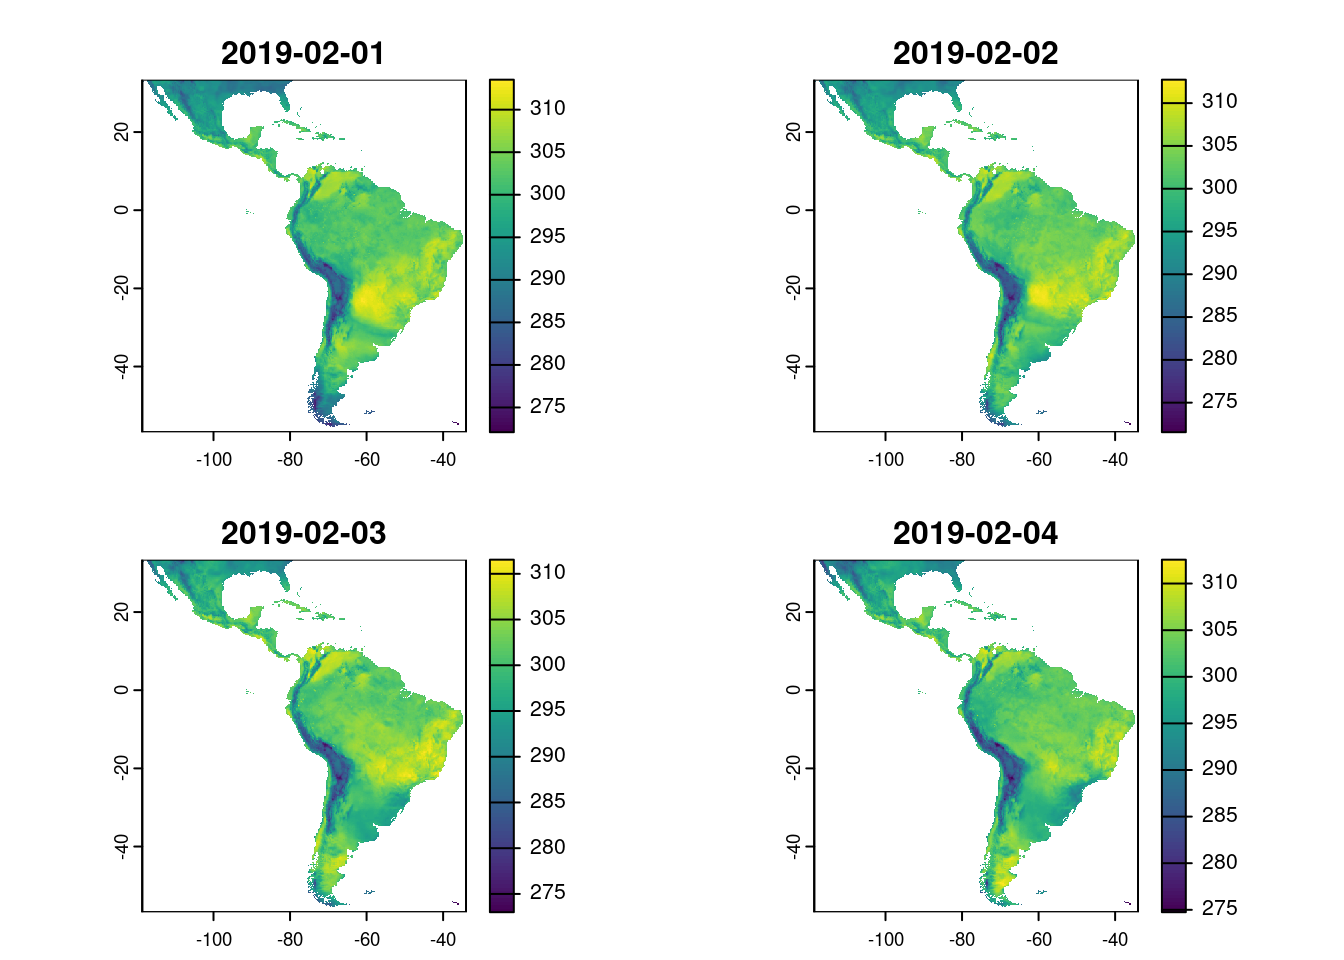
ReAnalysis climate data
-
ERA5-Land: global coverage, hourly and daily data, regular updates
-
BR-DWGD: Brazil coverage, daily data, sensible to extreme events, sporadic updates
-
TerraClimate: global coverage, monthly data, higher resolution (~4km), regular updates
Climate data for Brazilian municipalities
- Zonal statistics computation
- Adoption of exactextractr package for cell’s coverage weighted computations
- Creation of package
{zonalclim} with helper functions to compute scalable zonal statistics with chunks strategy
- DAG system using the targets package to compute climate zonal statistics for Brazilian municipalities
- Publication on Environmental Data Science journal
More details here
Example
![]()
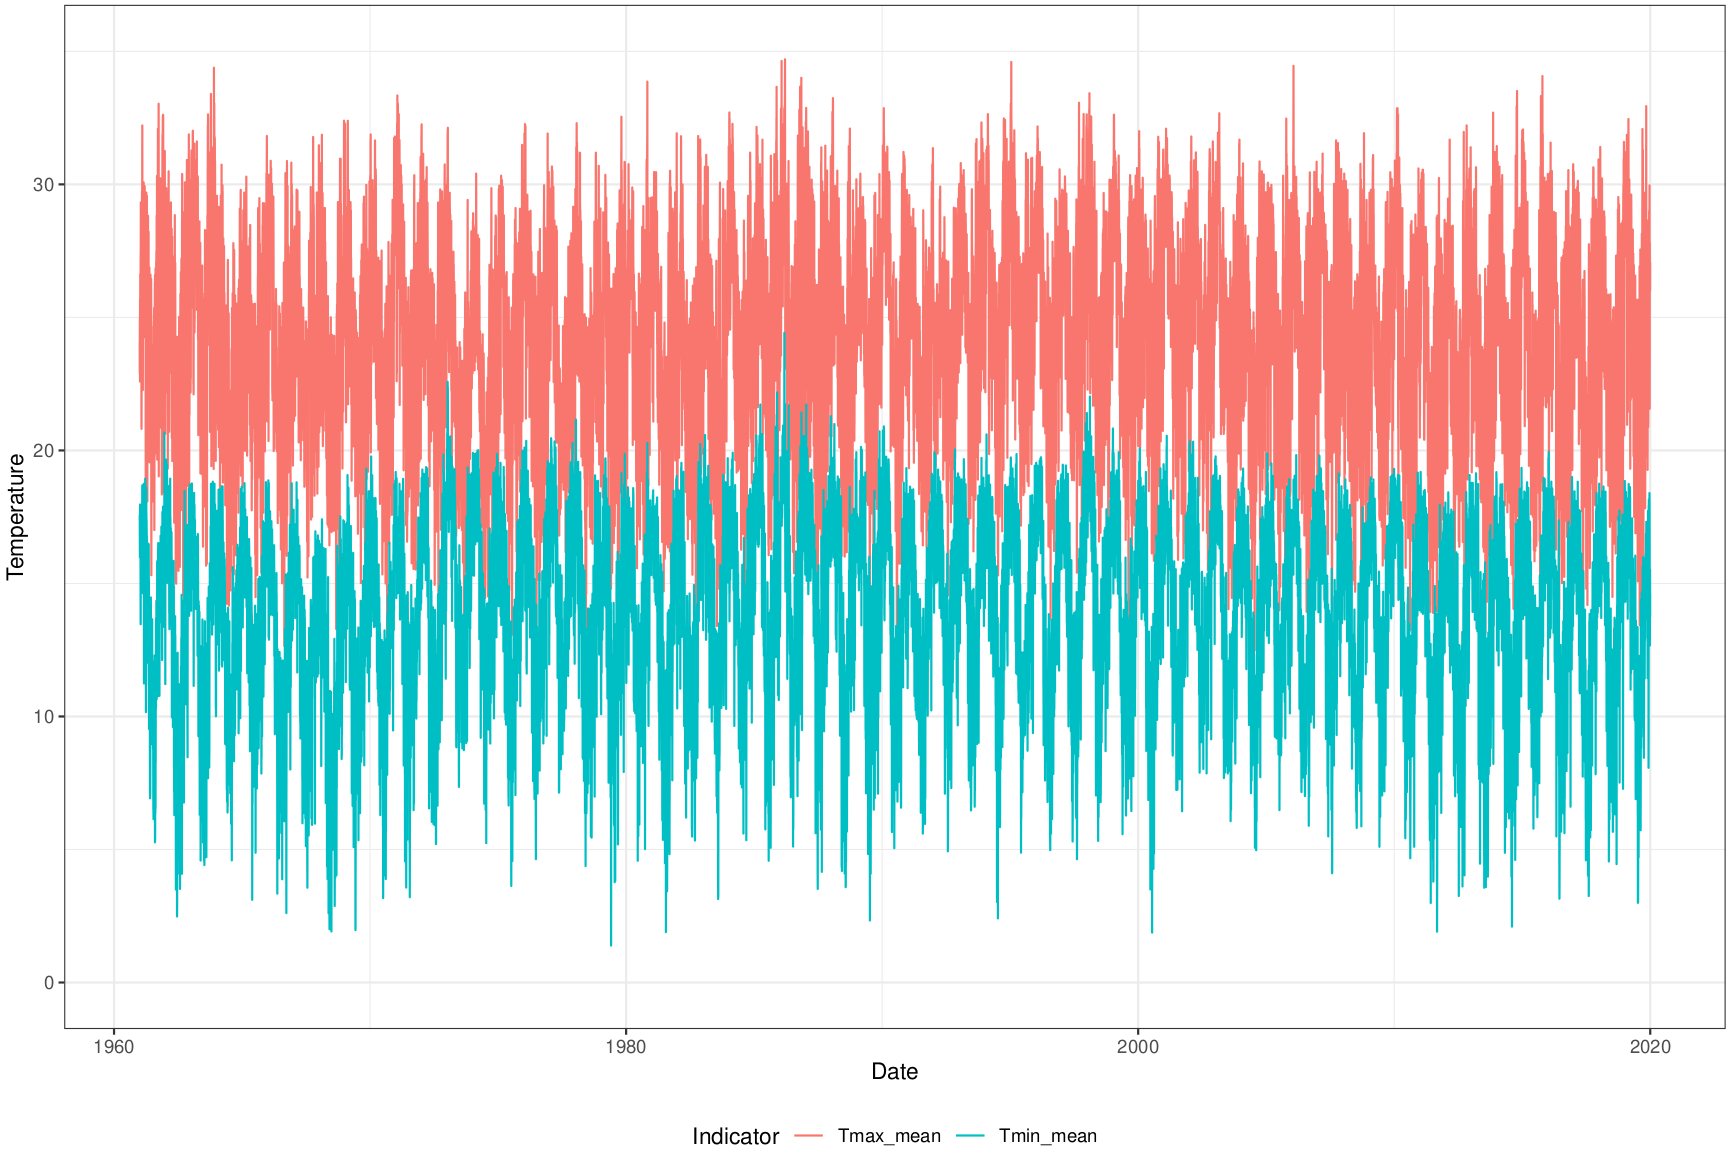
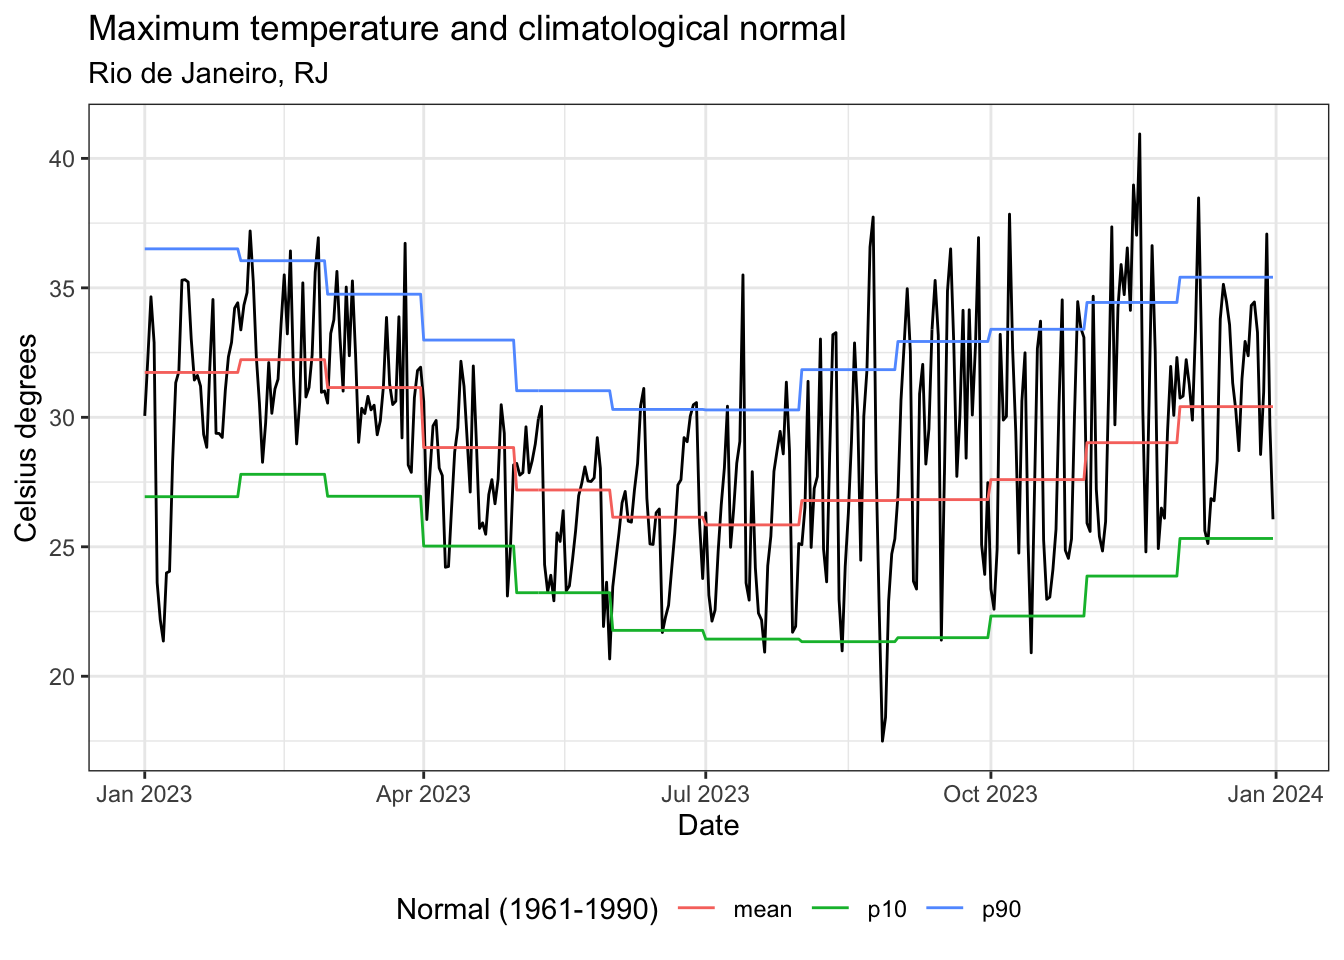
Climatological normals
- Climatological normals are computed only for weather stations and municipal references are needed for better climate change understanding
- Normals computed for each Brazilian municipality using the Zonal BR-DWGD from 1961 to 1990
- Mean, 10th and 90th percentile
- Temperature (max, min), precipitation, relative humidity, solar radiation, wind speed, and evapotranspiration
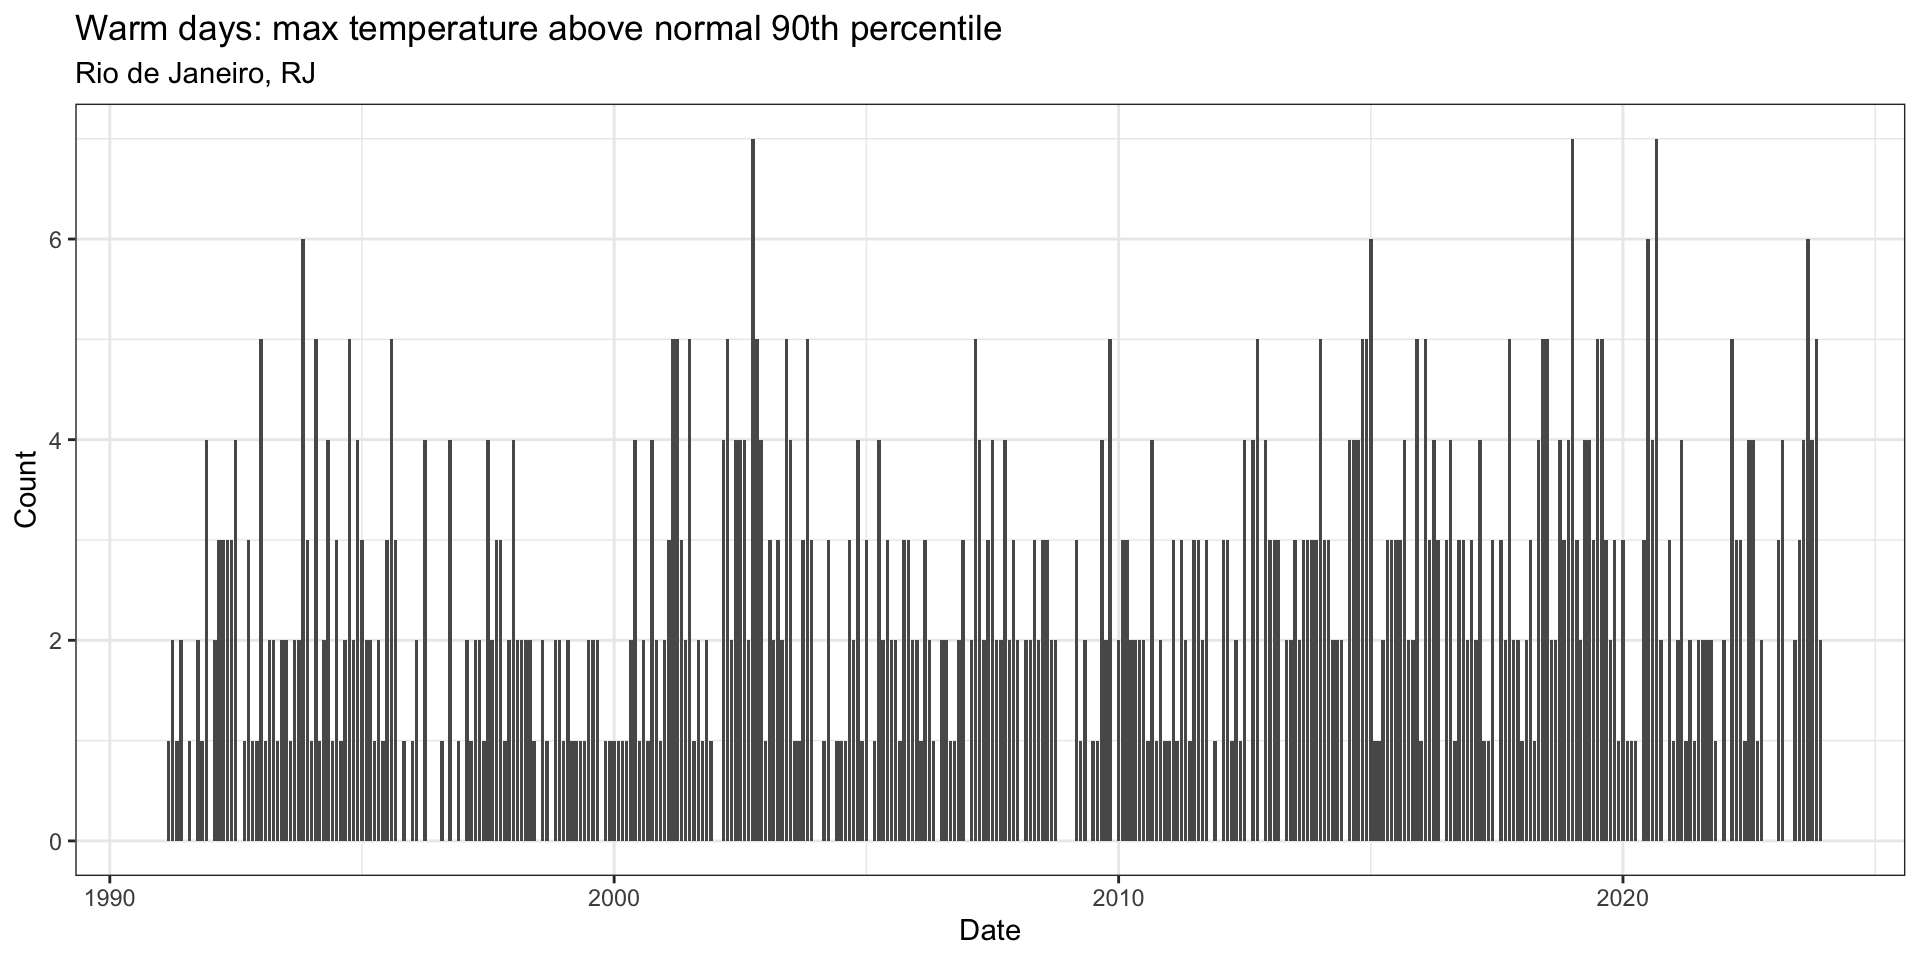
Time-aggregated indicators
- Municipal daily data time series to monthly indicators
- Monthly statistics
- Average, median, standard deviation, standard error, maximum and minimum values, and percentiles
- Occurence of events
- 22 indicators, in reference to normals or count sequence. Creation of nseq and climindi packages
- Heat waves, cold spells, count of warm days, count of dry and wet days, and others
More details here.
Future work
- Dashboards for weather stations
- Compute zonal statistics with populated areas weights
- Create other time-aggregated indicators
- Test the methodologies on other countries
- Compare ground-level data from weather stations with climate reanalysis datasets