library(tidyverse)
library(lubridate)
library(gt)
source("../functions.R")SDTW, cumulative and scaled long time series
Packages
Dengue data
# tdengue <- readRDS(file = "tdengue.rds")

dengue <- arrow::open_dataset(sources = data_dir("bundled_data/tdengue.parquet")) %>%
    select(mun, date, cases, cases_cum) %>%
    collect()
Clustering results
cluster_ids <- readRDS(file = "clust_sdtw_ids.rds")Identify municipalities
dengue <- left_join(dengue, cluster_ids, by = "mun")Cluster time series plot
ggplot(data = dengue, aes(x = date, y = cases, color = mun)) +
  geom_line(alpha = .3) +
  facet_wrap(~group) +
  theme_bw() +
  theme(legend.position = "none")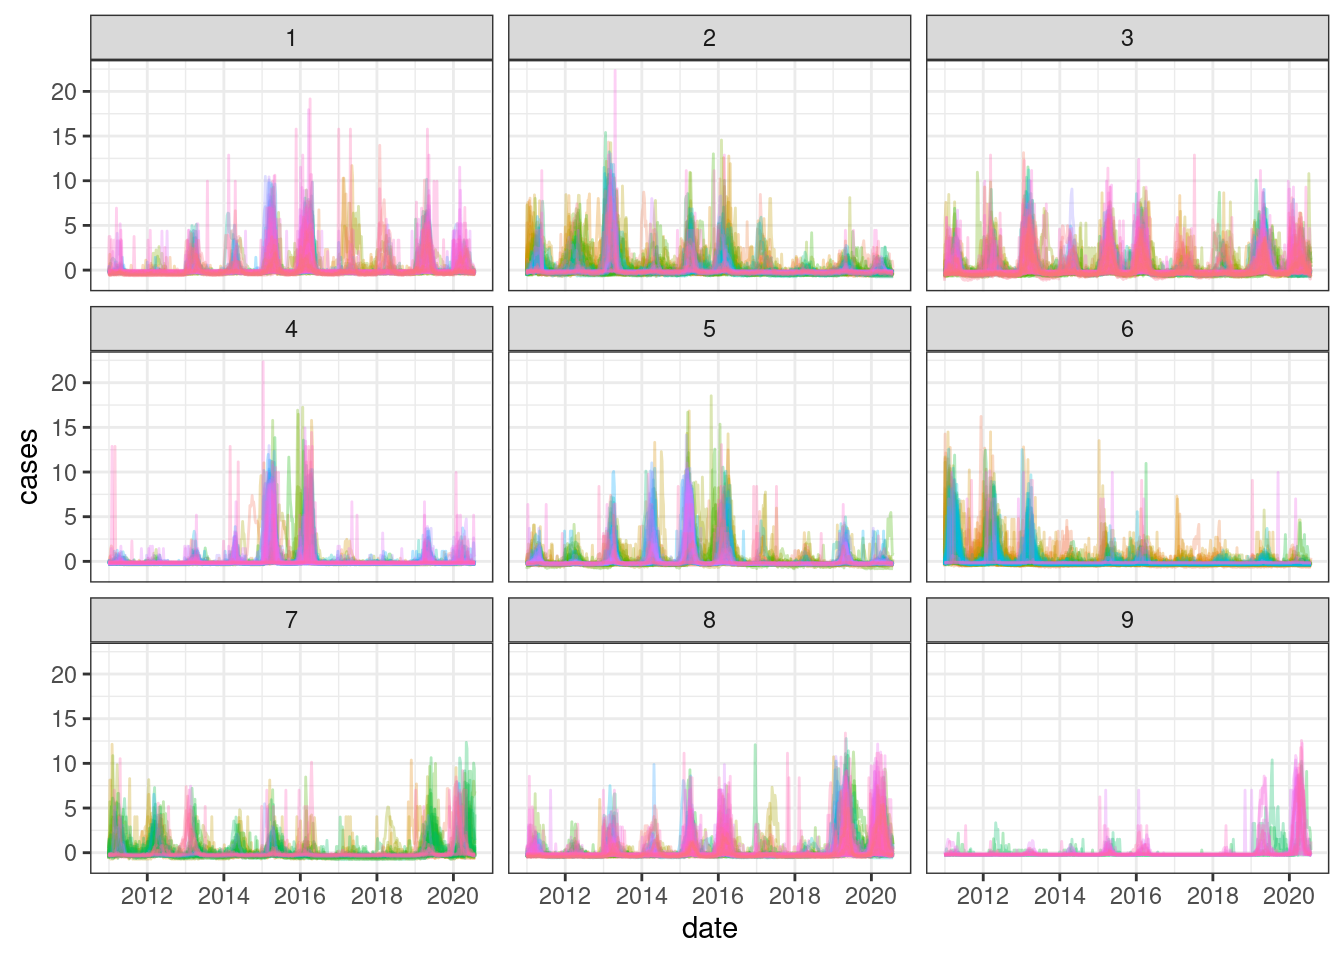
ggplot(data = dengue, aes(x = date, y = cases_cum, color = mun)) +
  geom_line(alpha = .3) +
  facet_wrap(~group) +
  theme_bw() +
  theme(legend.position = "none")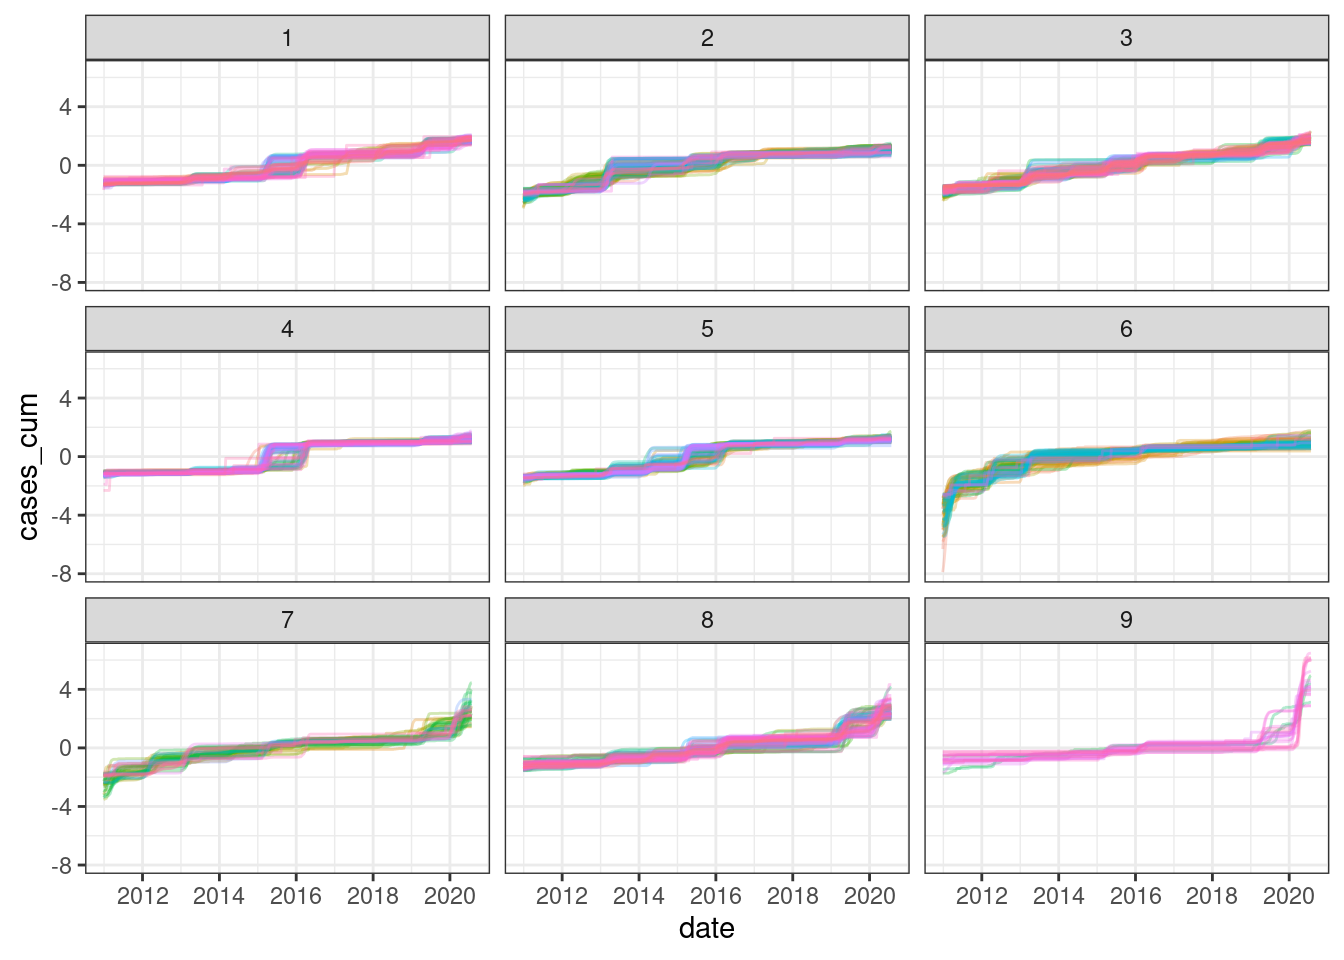
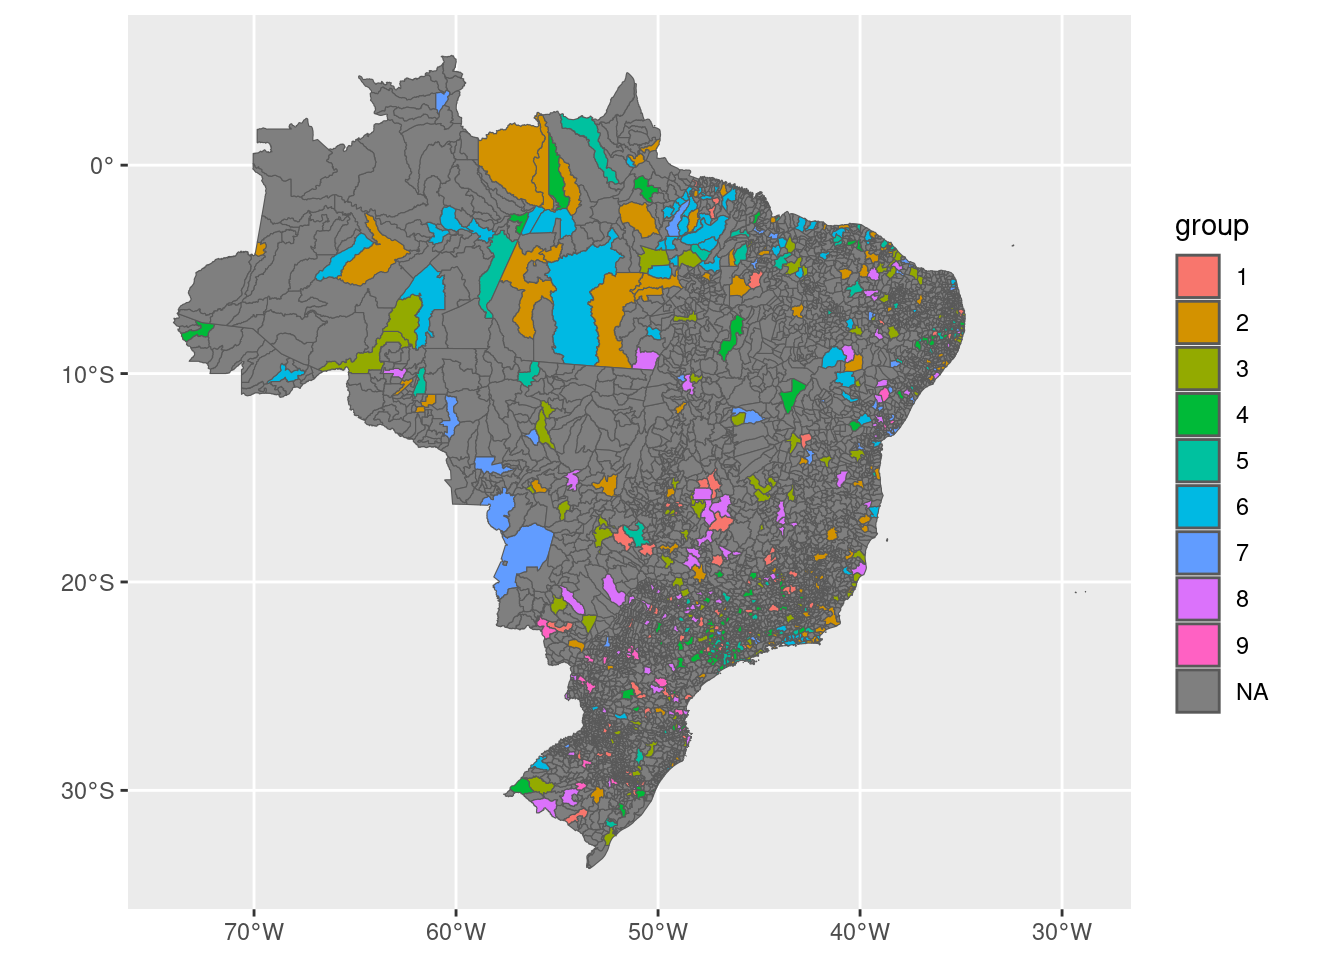
Map clusters
mun.shp <- geobr::read_municipality(showProgress = FALSE)Loading required namespace: sfUsing year 2010mun.shp %>%
mutate(code_muni = substr(code_muni, 0, 6)) %>%
left_join(cluster_ids, by = c("code_muni" = "mun")) %>%
ggplot() +
geom_sf(aes(fill = group))